
Using metrics to benchmark higher education IT financials, staffing, and services can add value by informing and reinforcing the decision-making process.

Leah Lang is Director of Analytics Services for EDUCAUSE.
A check of vital signs is the first step in any physical examination. A nurse measures and records current blood pressure, heart rate, respiration rate, and temperature: for example, 110 over 79, 77 beats per minute, 13 breaths per minute, and 97.8 degrees. These four metrics are the initial indicators of the patient's well-being; however, on their own they are ambiguous. To evaluate whether these metrics indicate health or cause for concern, medical practitioners must also be familiar with a set of benchmarks based on normal human physiology: 120 over 80, 50 to 80 beats per minute, 16 to 20 breaths per minute, and 98.6 degrees. When vital signs fall outside of an acceptable range of these benchmarks, practitioners begin an investigation for underlying causes.
Metrics and benchmarks are not just for medical professionals; they can be used by anyone in any field. Institutional leaders can use metrics and benchmarks to document current circumstances and evaluate organizational health. Generally, metric is defined as "a standard of measurement." A metric can be used to help understand an organization. The term benchmark is defined as "something that can be used as a way to judge the quality or level of other, similar things." Most commonly, benchmarking is thought of as comparing a metric with a gold standard or best practice, or other internal or external reference point, as a way to evaluate an organization.
Why Benchmark?
To run their institutions efficiently and effectively, leaders at today's colleges and universities must have a clear understanding of their own financial, staffing, and operational status. This information is critical to making informed decisions and optimizing the impact of information technology. Leaders can enhance their decision making by evaluating their financial, staffing, and operational status against comparable information for peers, aspirant peers, or even their own institution. For example, a metric on total central IT spending per institutional FTE (students, faculty, and staff) can be used to estimate the amount of IT support that individuals at an institution receive. Benchmarking this metric against peer institutions or an institution's past performance can help leaders make the case for additional resources.
In fact, leaders at both Marylhurst University and American University did just that.During an organizational transition at Marylhurst University, the IT department used metrics and benchmarks from the EDUCAUSE Core Data Service (CDS) to introduce new institutional leaders to the current IT environment and set the context for future plans.1 Nathan Phillips, Director of the Center for Learning and Technology at Marylhurst University, reported: "CDS data helped us provide a strong case for increasing our support services, since we have been understaffed compared with similarly sized institutions." Similarly, American University tracks resource allocation over time against CDS benchmarks. According to Terry Fernandez, Senior Director of IT Customer Service and Support at American University: "Each year when the results are released, we have used them to benchmark ourselves against our peer institutions. It has been most helpful to compare staffing levels and budgets for the IT organization as a whole, as well as individual focus areas. We have been able to successfully advocate for additional or reallocated resources, based on the normalized data."
Since 2002, the EDUCAUSE Core Data Service (CDS) has been providing higher education CIOs and senior IT leaders with the benchmarks they need to make strategic decisions about information technology at their institutions. On average, more than 800 institutions (both within and outside the United States) participate in a survey about IT financials, staffing, and services. For their time and effort, survey participants are rewarded with access to CDS Reporting, a self-service tool that enables institutional leaders to benchmark their IT organizations against those of their peers. In addition to gaining access to CDS Reporting, IT leaders also participate in the CDS for the following reasons:
- To study their IT organization
- To benchmark against past performance
- To look at trends over time
- To start gathering and using metrics
- To have data available "just in case"
How to Benchmark
Colleges and universities that benchmark successfully follow seven steps (see Figure 1).2
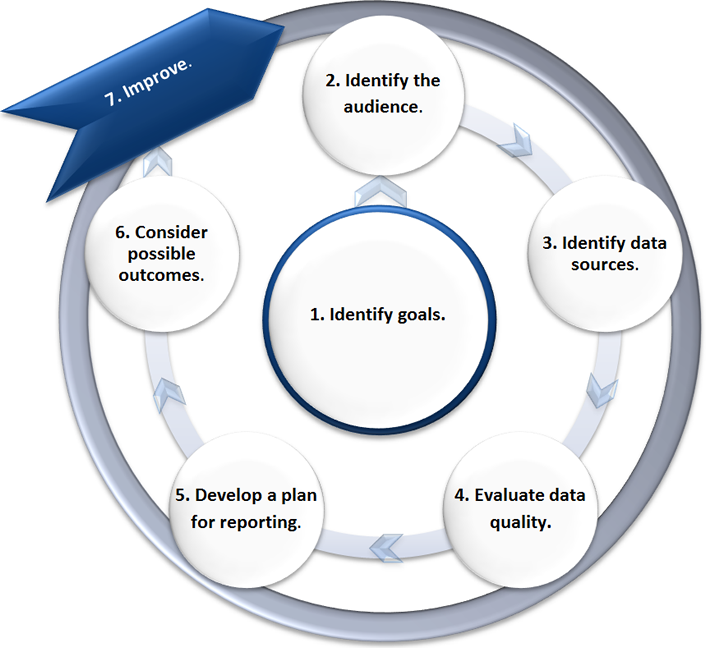
Figure 1. How to Benchmark
Step 1. Identify goals. General benchmarking assessments will start with goals such as "identify best practices" or "communicate the value of information technology." More specific benchmarking assessments may aim to track progress on strategic initiatives or the EDUCAUSE 2015 Top 10 IT Issues.3 Questions to ask include the following:
- What is the purpose of this benchmarking assessment?
- If there are several goals, how are these goals prioritized?
Step 2. Identify the audience. It is important to consider who is requesting the information and to have an idea of their motivations, their understanding of the content, and their preference for consuming information. These details will be useful in rightsizing the benchmarking assessment. For example, a data-savvy audience with mission-critical concerns may require more data accuracy than a group of data novices who are just starting to use metrics. Questions to ask include the following:
- Is data being gathered for leaders, users, or service owners?
- To what extent will the audience rely on this data to inform decision making?
- What level of specificity in the data will the audience expect?
Step 3. Identify data sources. Data can be found anywhere—from server logs to annual reports to external sources like the EDUCAUSE CDS. The data used will largely depend on the goals established in Step 1. Table 1 shows an example of how CDS data and benchmarks can be used to track progress on the EDUCAUSE 2015 Top 10 IT Issues.
Table 1. Using CDS Data to Track Progress on the EDUCAUSE 2015 Top 10 IT Issues
|
2015 Top 10 IT Issue |
Supporting Metrics |
|---|---|
|
1. Hiring and Retaining Qualified Staff, and Updating the Knowledge and Skills of Existing Technology Staff |
|
|
2. Optimizing the Use of Technology in Teaching and Learning in Collaboration with Academic Leadership, Including Understanding the Appropriate Level of Technology to Use |
|
|
3. Developing IT Funding Models That Sustain Core Service, Support Innovation, and Facilitate Growth |
|
|
4. Improving Student Outcomes through an Institutional Approach That Strategically Leverages Technology |
|
|
5. Demonstrating the Business Value of Information Technology and How Technology and the IT Organization Can Help the Institution Achieve Its Goals |
|
|
6. Increasing the IT Organization's Capacity for Managing Change, Despite Differing Community Needs, Priorities, and Abilities |
|
|
7. Providing User Support in the New Normal—Mobile, Online Education, Cloud, and BYOD Environments |
|
|
8. Developing Mobile, Cloud, and Digital Security Policies That Work for Most of the Institutional Community |
|
|
9. Developing an Enterprise IT Architecture That Can Respond to Changing Conditions and New Opportunities |
|
|
10. Balancing Agility, Openness, and Security |
|
Questions to ask include the following:
- What data is available today?
- Is additional data needed to achieve the goals established in Step 1?
- Against which groups or institutions will the comparison be made? Demographic peers? Geographic peers? Aspirational peers?
Step 4. Evaluate data quality. Once the data has been gathered, the next step is to determine whether it contains any errors. Also, consider whether the data needs to be reformatted or whether secondary variables must be calculated using the original data source. Evaluating data quality is important even when using CDS data, which is self-reported through an annual survey. Those who analyze CDS data should evaluate whether the budget and staffing numbers reported are in line with what is expected, and they should report when data look suspicious.4 Institutional leaders are also encouraged to reach out to peers to validate data and better understand the context behind possible outliers. Fernandez, from American University, has noted: "We have been able to use the data to make more informed decisions and follow up directly with peer institutions that have similar circumstances." Questions to ask include the following:
- Are there any outliers? Why are they outliers?
- Is the data source trustworthy, or does the data need to be validated before using it?
Step 5. Develop a plan for reporting. When reporting results, presenters must consider how the information will be shared and whether the data will be reported at the right frequency, in the right formats, and to the right people. They must consider how the data should be contextualized and what groundwork should be set to explain the intent and limitations of the data. With new benchmarking assessments, it may be wise to test the initial report with an internal audience and with peers from other institutions to gather feedback about data quality, setting an appropriate context around the data and the report format, before sharing results with executives. This may prevent any out-of-hand dismissal of results—a reaction that can occur when the audience has doubts about the data. It can also ensure that IT managers are aware and supportive of sharing their service's benchmarks with institutional leadership. Questions to ask include the following:
- Will this information be presented in person or in writing?
- What background or contextual information should be presented to explain the data and its limitations?
- How often will it be necessary to refresh and reproduce this report?
Step 6. Consider possible outcomes. A critical component of any benchmarking assessment is a plan for how the results will be used. Benchmarking is often used to identify anomalous circumstances; unexpected results should be the starting point of an investigation. Key stakeholders should be in agreement on courses of action and possible outcomes. In addition, before reporting the results of an assessment, presenters should review the plan and take a few moments to anticipate how the results may influence decision making. Questions to ask include the following:
- What decisions need to be made with this information? Is the report clearly driving toward those decisions?
- Will the audience want to take action after hearing the results?
- What additional investigations could be conducted to learn more about anomalous results?
Step 7. Improve. Finally, in the name of continuous improvement, it is always important to explore options for improving any or all elements of a benchmarking assessment. Questions to ask include the following:
- Was the data that was included in the analysis the right data to use?
- Was the report or benchmarking tool useful?
- Should any additional audiences see the report next time?
Benchmarking Financials, Staffing, and Services
The first step toward strategically funding information technology is to identify IT budget parameters based on the type, the population, and the budget of the institution. Then, based on institutional priorities and the current IT environment, IT leaders can determine a spending portfolio that will get them to where they want to be. Breaking the budget down by dollars spent (1) on running, growing, and transforming the institution, (2) on each IT domain area, and (3) for capital and operating work will help them determine the right blend of innovation spending to operating spending for all areas of information technology.
Benchmarks on IT financials can help IT leaders answer the following questions:
- What is a practical range for total IT budget based on the type, the population, and the budget of the institution?
- Are changes in budget from the previous fiscal year in line with changes in peer budgets?
- What is an appropriate distribution of spending for the institution?
Staffing models are evolving. Hiring and retaining qualified staff, and updating the knowledge and skills of existing technology staff, is the #1 Top 10 IT Issue in 2015.5 Services are being outsourced, but institutions need staff to manage outsourcing, and they need more services and bandwidth to support BYOD. Does this mean fewer staff, or does it mean similar numbers of staff with different skillsets? Through this evolution, IT leaders will want to keep an eye on several benchmarks: ratio of central IT staff to institutional FTE; student workers as a percentage of total central IT FTE; percentage of IT staff across IT domain areas; and training spending per IT staff. Keeping an eye on how others are staffed and knowing how peers balance their staff portfolio can help IT leaders find the right fit. Knowing what peers are spending on staff training can likewise help IT leaders budget for updating the skillsets of existing staff.
Benchmarks on IT staffing can help IT leaders answer the following questions:
- What is a practical range for staff size based on institution type and size?
- What is the right blend of staff?
- What is an appropriate budget to retrain current staff?
Finally, in a changing environment it is important to know which services are in demand and which are fading in importance, which services should stay local and which can be outsourced, and which services must have mobile deployment or be accessible via the cloud. Providing the right services in the most efficient manner is critical. The EDUCAUSE CDS has data that can help IT leaders understand how peers are supporting users in mobile computing, online education, and cloud/BYOD environments. CDS data on faculty support services can help IT leaders determine how to help faculty optimize the use of technology in teaching and learning, whereas data (including vendor/product, deployment, and management strategy) on fifty different information systems can help IT leaders strategize for an enterprise architecture that is right for the institution.
Benchmarks on IT services can help IT leaders answer the following questions:
- What services should be provided?
- How should the institution provide those services?
- How can service owners evaluate service efficiency or effectiveness?
- What other institutions are using the same vendor (or are considering the same vendor) for a particular application?
A New Generation of IT Assessment Tools
A new culture of data-driven decision making, together with rising pressure from boards and legislatures to measure institutional performance, is feeding demand for better, cheaper, and faster ways to assess information technology. With support from the Lumina Foundation, EDUCAUSE is working to improve the value and efficiency of the contribution of information technology to higher education by developing an innovative new service for IT benchmarking and assessment.
This new online service will help IT leaders communicate the value and relevance of information technology to non-IT leaders, as well as help them assess and benchmark maturity and technology deployment for a suite of strategic initiatives. Maturity indices measure the capability to deliver IT services and applications in a given area. They examine multiple dimensions of progress, technical and nontechnical—such as culture, process, expertise, investment, and governance. They enable institutional leaders to determine where they are in delivering a service, and where they aspire to be. Deployment indices measure the degree to which an institution has deployed the technologies related to delivering a service, based on a standard scale reflecting stages of deployment.
This online service will build on the CDS database and reporting tools and will leverage other EDUCAUSE data and analytical frameworks to create a snapshot of internal performance and to allow comparison with peer institutions or other desired comparison groups. Development and prototyping of the new service is under way, and the service will enter production in the first quarter of 2016.
Next Steps
The following recommendations can help IT leaders take full advantage of the EDUCAUSE CDS.
Measure distributed IT resources. To make informed IT decisions, institutional leaders need a full picture of information technology campus-wide, not just of the central IT organization. However, data on distributed IT resources remains elusive. In partnership with NACUBO, the ECAR-COST Working Group is currently researching barriers to gathering this data and is developing strategies to overcome the barriers. As a first step, CIOs are encouraged to work with institutional leadership, including human resources, to develop practices for gathering more reliable information about distributed IT resources.
Participate. From the Institutional Research department to the Human Resources, comparative data about resources is being collected at all levels of the institution. Leaders can stay ahead of the game and in control of the IT benchmarking at their institution by participating in CDS. They should consider adding data to the next CDS survey, launching in July 2015.
Use the data. Anyone can benchmark an institution against peer institutions in similar Carnegie Classifications with the 2014 CDS Almanacs or the 2014 CDS Benchmarking Report, a customizable slide presentation that can be used to integrate core data into campus presentations and strategic planning. In addition to these publicly available resources, those at participating institutions can use the data found in CDS Reporting to inform their planning.6 Ted Bross, Associate Director for Administrative Information Services at Princeton University, notes: "While aggregation of data puts a reasonable framework around large data sets and often helps to suggest conclusions or findings, the importance of looking at the raw data . . . cannot be overestimated."
Encourage peers. The CDS database is only as strong as the number of institutions that contribute data each year. The benchmarking capability of the data is maximized with robust peer groups. Encouraging peers to participate in the survey and to use the data ensures a rich database for all.
Stay informed. EDUCAUSE offers numerous ways for IT leaders to find information about survey open and close dates, about completing the survey, about using CDS data, and much more.7
The landscape of higher education is changing rapidly. As a facilitator of process change, efficiency gains, and enriched learning, information technology clearly adds value to the higher education institution. Using metrics to benchmark higher education IT financials, staffing, and services can add further value by informing and reinforcing the decision-making process throughout this journey.
 Infographic: Benchmarking to Inform Planning
This article was published with a complementary infographic that visually depicts how the Core Data Service can inform key institutional planning questions on IT financials, staffing, and services.
- For more on how higher education IT leaders use CDS to inform their planning, see the recorded webinar "The EDUCAUSE Core Data Service: Core Metrics in Action."
- For more information about getting started with benchmarking, view the short EDUCAUSE video "Benchmarking for CIOs."
- Susan Grajek and the 2014–2015 EDUCAUSE IT Issues Panel, "Top 10 IT Issues, 2015: Inflection Point," EDUCAUSE Review, vol. 50, no. 1 (January/February 2015).
- Suspicious data may be reported by e-mail to [email protected].
- See Grajek et al., "Top 10 IT Issues, 2015."
- For an introduction to how to use CDS Reporting, view the "CDS Reporting Demo" video.
- Subscribe to monthly newsletters; join the CDS discussion list; attend CDS Office Hours; and explore the CDS website.
© 2015 Leah Lang. The text of this article is licensed under the Creative Commons Attribution-NonCommercial-NoDerivatives 4.0 International License.
EDUCAUSE Review, vol. 50, no. 3 (May/June 2015)