
This article is an executive summary of the recent paper produced by the Coalition of Higher Education Information Technology Associations (CHEITA) Benchmarking Working Group.
Higher education is now a global business, with real benefits from sharing best practices at both an association and individual-institution level to develop more effective and efficient IT services. Benchmarking is part of that sharing — by comparing ourselves with our peers we can begin a conversation about how we provision services and identify areas where our performance doesn't meet that of other institutions, and then address those issues. To facilitate cross-border comparisons appropriate for the global higher education business, we need a way to compare individual institutions. The Coalition of Higher Education Information Technology Associations (CHEITA) includes representatives from associations throughout the world — including EDUCAUSE — that promote the use of information technology in higher education. CHEITA created the Benchmarking Working Group to explore the viability of benchmarking IT in higher education on a global scale with the goal of identifying a single model that would enable the international higher education IT community to use consistent and relevant information for institutional decision making. The first step in achieving this goal resulted in the development of the CHEITA Global Complexity Index — a methodology that uses three factors to identify institutions of similar complexity, and thus similar IT cost profiles.
Key benefits of the CHEITA Global Complexity Index include:
- The index builds on an index used by the Council of Australian University Directors of Information technology (CAUDIT), which already has international reach resulting from its use in Australia and New Zealand, Canada, and South Africa.
- Calculation and use of the index are relatively simple and straightforward.
- Most participating countries can calculate the index from publicly available data, which gives it a degree of robustness and independence from data collection at the institutional level.
- It is based on stable institutional measures (student FTE, staff FTE, and research income) rather than technology measures (e.g., number of servers), which vary over time based on technology change and adoption rates.
- It can readily identify members of peer groups that could undertake deeper benchmarking. This is especially relevant for smaller sectors that need to expand their peer group.
- The index can be used in parallel with other classification approaches to further refine large peer groups (e.g., find peers within a Carnegie classification).
- It can identify outliers in data by plotting predicted values against actual values. Outliers above an expected range can be investigated for poor data quality due to over counting, higher complexity than expected, or a deliberate strategy that would cause higher values. Outliers below an expected range can be investigated for inverse causes.
The standardization of institutional types through the CHEITA Global Complexity Index democratizes association work across the global higher education community by giving a voice to international institutions represented in association research and benchmarking activities. The index also opens the door for developing more meaningful international higher education IT research collaborations, partnerships, and communities of practice.
International Benchmarking at EDUCAUSE
Since 2002, the EDUCAUSE Core Data Service (CDS) has provided higher education CIOs and senior IT leaders with benchmarks to make strategic decisions about IT at their institutions. On average, more than 800 institutions (both within and outside the United States) participate in the annual CDS survey about IT financials, staffing, and services. Participating institutions range in type from small (800 students) to large (75,000 students), privately to publicly funded, and community colleges to doctoral-granting, research-intensive institutions. Survey participants have access to CDS reporting, a self-service tool that enables institutions to benchmark their IT organizations against their peers.
Finding peer institutions within the United States is simplified with the use of the Carnegie Classification system, a standardized scale developed to categorize institutions based on degree offering. This system provides an effective means of finding peer institutions within the United States. However, it does not apply to non-U.S. institutions and therefore does not facilitate international benchmarking. While EDUCAUSE has international representation in its membership, the EDUCAUSE research products have traditionally offered a U.S.-centric perspective of current issues and practices in higher education IT. Though the association gathers responses from both U.S. and non-U.S. institutions in the CDS survey, the U.S. data have been disaggregated by Carnegie Classification and control (public versus private), and non-U.S. institutions have been aggregated into one "non-U.S." category. This containerized analysis allows comparison between U.S. and non-U.S.-based institutions, but with limited value to both groups.
Starting in 2015, EDUCAUSE will integrate the CHEITA Global Complexity Index into CDS Reporting. This will help enable international benchmarking and institutional complexity comparisons in CDS analysis and reporting functions, as well as will allow more meaningful and influential use of non-U.S.-based institutional data in EDUCAUSE research products. To access this benefit, institutions must participate in the CDS 2015 survey.
The CHEITA Global Complexity Index
The CHEITA Global Complexity Index consists of three weighted variables: staff FTE (35 percent), student FTE (35 percent), and research income (30 percent; converted into U.S. dollars using the purchasing power parity, or PPP1). The methodology used to develop the CHEITA Global Complexity Index relied on several assumptions:
- Separate inherent complexity from introduced complexity: The index deliberately does not try to capture introduced complexity such as the degree of centralization of IT service delivery or the proliferation of systems with similar capabilities (e.g., multiple finance or teaching and learning systems).
- The index accounts for most institutional complexity: While additional factors might also contribute to institutional complexity, they are not considered significant enough to prevent the complexity index from being used to make meaningful international comparisons. Indeed, use of the index is expected to help quantify the significance of these other drivers.
- All countries have access to similar data: In countries that do not have publicly available data on research income, student FTE, and staff FTE, CHEITA participants can either collect these data through existing surveys or find suitable approximations. In some countries, publicly available figures for research expenditures and an estimate of staff FTE based on staff headcount were used as proxy variables for research income and staff FTE.
Proof of Concept
As a proof of concept, the CHEITA Global Complexity Index was used to compare IT expenditure data from 235 universities in 11 countries (figure 1).
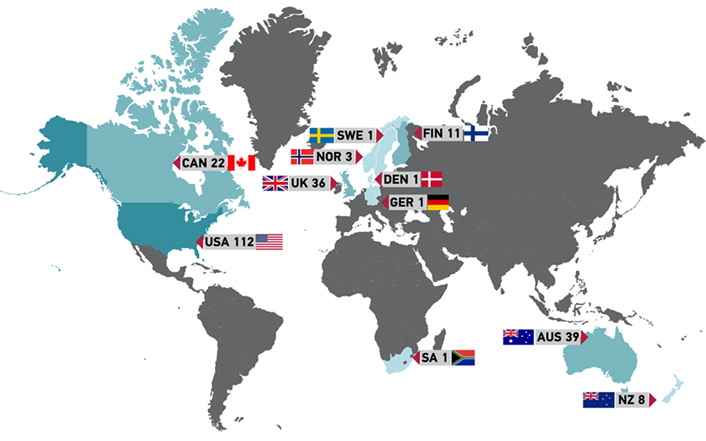
Figure 1. CHEITA Global Complexity Index proof-of-concept participation
Anonymized data sets from each CHEITA benchmarking working group member organization were first normalized to USD using PPP. The normalized data sets were then used to calculate the CHEITA Global Complexity Index for each institution. As a test of the viability of the index, IT expenditure (in USD) for each institution was then graphed against the CHEITA Global Complexity Index. As can be seen from figures 2 and 3, there is a strong correlation between institutional IT expenditure and the CHEITA Global Complexity Index. Whereas figures 2 and 3 demonstrate how the CHEITA Global Complexity Index can be used to compare institutional IT expenditure, it can of course be used to compare other variables, such as the number of IT staff employed within an institution or the cost of employing those staff.
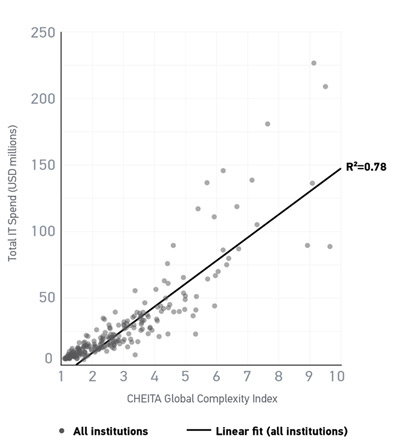
Figure 2. Complexity index by total IT spend (USD)
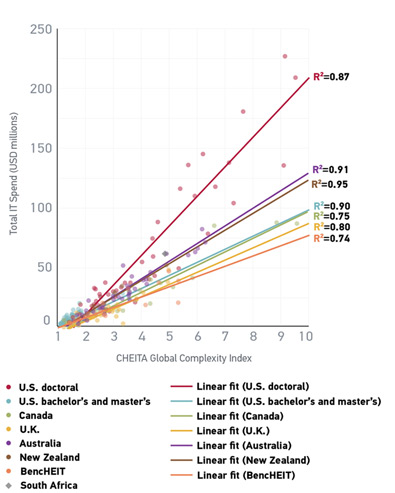
Figure 3. Complexity index by total IT spend (USD), by country
In the overall sample (figure 2), four-fifths (78 percent) of the variability in IT spending can be explained by the CHEITA Global Complexity Index. For individual countries (or for a group of countries, in the case of BencHEIT, a European-level effort), figure 3 shows that the index explains between 74 percent (BencHEIT institutions) and 95 percent (New Zealand institutions) of the variability in IT spending.
The difference in the slopes of the linear fit lines in figure 3 clearly shows that for the same institutional complexity, IT expenditure is greatest in the United States (for doctoral institutions), followed by Australia, New Zealand, U.S. bachelor's and master's institutions, Canada, the UK, and the BencHEIT countries. On closer analysis, IT expenditure levels appear to fall into three loose categories. One contains U.S. doctoral institutions, another encompasses Australia and New Zealand, and the third contains U.S. bachelor's and master's institutions, Canada, the UK, and the BencHEIT countries. Clearly, further analysis is needed to understand what drives the difference in expenditure levels in each of these categories, and the CHEITA Global Complexity Index can facilitate this analysis by identifying a group of universities (e.g., with similar complexity from 11 different countries) whose expenditures can be studied in more depth.
These initial results confirm that the index is a viable methodology for comparing institutions of similar complexity internationally.
For More Information
For more details on the CHEITA Global Complexity Index, see the full-length paper from which this article was excerpted: "Benchmarking IT: A Global Approach." To learn about the benchmarking programs available for your institution and/or the complexity index calculation for your institution, please visit the CHEITA website.
Note
- PPP is calculated on a biennial basis. For the purposes of the complexity index, institutions should use the most recent data available. For more, see the OECD's Prices and Purchasing Power Parities (PPP).
Leah Lang is director of Analytics Services at EDUCAUSE. Prior to working with EDUCAUSE, she was a service and metrics analyst at Carnegie Mellon University where she conducted surveys and developed metrics that were used to inform IT project and service decisions. She has also worked as a mathematical statistician at the US Census Bureau, where her work entailed research and development for the American Community Survey and weighting and variance estimation for the Current Population Survey. Lang has a BS in Statistics from Penn State and an M.S. in Survey Methodology from the University of Maryland.
Karen A. Wetzel is program manager for the ECAR Working Groups at EDUCAUSE. She has worked in higher education for nearly 20 years, joining EDUCAUSE in 2011. Previously, she served as standards program manager for the National Information Standards Organization, where she oversaw all standards development work and reporting; developed and organized outreach and education programs; and created organizational procedures and policies. Previously, she worked with the Association of Research Libraries, where she managed the association's distance learning initiative. She holds a BA from the University of California, Los Angeles, an MA from Boston College, and an MLS from the Catholic University of America.
© 2015 Leah Lang and Karen A. Wetzel. The text of this EDUCAUSE Review article is licensed under the Creative Commons BY-NC-ND 4.0 license.