
Key Takeaways
- Adding to the scant existing research into how students actually use IT on campus, this study yielded a robust data set that included 183 hours of observation and 393 intercept interviews gathered in four specific locations on the Fresno State University campus.
- Based on this data, the study team developed a space–use continuum for the campus to help in facilities and IT planning; the goal was to bolster features and services that can better facilitate student work and activities in particular areas.
- The study looked at two different activity types — knowledge production and consumption — and how students pursued these activities in various ways in four different location types, which ranged from a popular outdoor space to more traditional study spaces.
- Given the study's findings, planners can better consider student expectations for space-specific technology and technology support, including more robust wireless access, printing, and cloud access from anywhere and with any device.
At California State University, Fresno, Henry Delcore is a professor in the Department of Anthropology, Cynthia Teniente-Matson is vice president for Administration and CFO, and James Mullooly is associate professor in the Department of Anthropology.
Understanding student use of campus spaces is crucial to programming space, selecting interiors, and planning IT infrastructure. Campus facilities and IT managers make efforts to understand student needs and anticipated demands based on a range of campus user perspectives, architectural consultants, and national surveys; however, they rarely have access to data on student IT use on the ground.
Direct observation of how students use spaces — focusing particularly on IT usage — is exceedingly rare. It's even more difficult to find studies that support specific institutional campus cultures, such as an institution that serves the Hispanic community, with its large percentage of first-generation students. Joanna Bryant and colleagues1 and Charles Crook and Gemma Mitchell2 present findings from direct observation of students in campus spaces, but they do not focus on IT use and its implications for infrastructure and service design. Christopher Cooley and colleagues3 take a more IT-focused approach in their own observational work.
Our work seeks to build on these glimmers of understanding of actual IT behavior among students at California State University, Fresno based on a robust data set that includes 183 hours of observation and 393 intercept interviews focused on how students use IT in four different campus spaces. Our data showed significant differences among spaces, with clear implications for how space programming and IT planning can be targeted to facilitate student work. Our findings also highlight the need for better direct observational data on student IT behavior on campus.
The Space–Use Continuum
We argue that campus facilities and IT planners should reexamine campus spaces along a use continuum characterized by different combinations of student work, activity, and device types. We created this continuum based on in-depth campus observations. The continuum is applicable to comparable institutions with a range of mixed-use facilities consisting of aging infrastructures; new facilities, alongside those that are 25 years old or more; and robust outdoor green rooms. Planners should also consider the continuum's various factors as they exist in their particular campus contexts.
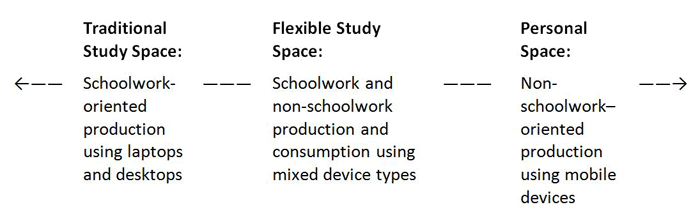
Figure 1. The campus spaces continuum
The continuum's far left end is characterized by traditional study spaces, in which students use laptops and desktops for schoolwork involving text production and other digital outputs (we elaborate on our use of the term production below). The clearest case of a traditional study space on our campus is at the east end of the Henry Madden Library's second floor, just outside a Starbucks coffee shop. In this newly constructed facility, the dominant activity is schoolwork-oriented production on student-owned laptops.
The continuum's middle is occupied by flexible study space, in which students engage in various school and non-school-related production and consumption activities on laptops, desktops, and other devices. In our study, the flexible study space is on the second floor of our University Student Union.
The continuum's far right is the personal space, where students engage mostly in non-schoolwork activities on mobile devices. Our campus has a variety of outdoor green spaces, and we discovered a representative personal space in a bustling student hangout at the center of campus: the area around a water fountain with outdoor seating.
We can use the data that informs our continuum description to build a typology of spaces. Indeed, we label some spaces and refer to them generally here. However, a continuum model is both more elegant and more useful for strategic planning for several reasons:
- First, a continuum recognizes that there are an infinite number of spaces in which uses are always in flux, and it eschews forcing this diversity of student space usage into a static typology.
- Second, in terms of application, each continuum point implies particular IT and interior programming requirements. Once you identify a campus's space–use continuum and place an inventory of relevant spaces along it, planners can address growing demands for robust space while also integrating technology usage along the entire continuum. Planners can also readily perform a gap analysis of the existing space-allocation ecology when planning for new spaces, renovating existing facilities, or expanding outdoor spaces to address unmet demand and support student work and activities.
- Finally, space programming along the continuum can be enhanced to offer flexible options for production and consumption based on unique microenvironments within the campus footprint.
Methods
Although the nature and process of our collaboration are largely outside this article's scope, our collaborative framework let us leverage a wide range of campus resources and expertise and target the findings to a range of stakeholders. The process began when Cynthia Teniente-Matson approached Hank Delcore and James Mullooly to inquire about conducting a study similar to the one by Cooley and colleagues.4 Once we agreed on some initial parameters drawn from the campus strategic plan, Teniente-Matson engaged campus leaders in instructional IT and social media to help Delcore and Mullooly formulate study questions. Delcore and Mullooly then took the project into their Ethnographic Fieldwork courses in fall 2012 and spring 2013, engaging 20 anthropology students each semester as research assistants. Under Delcore and Mullooly's supervision, the students did the bulk of the fieldwork and engaged in a collaborative analysis process with their professors. Nine of the students then made presentations at two different professional conferences (including EDUCAUSE Connect Chicago in March 2014). Support for assigned time and other study costs came from Teniente-Matson's office and the Office of the Provost.
Between September 2012 and May 2013, anthropology student researchers conducted a total of 183 hours of observation of student IT use in four target areas:
- the outdoor fountain at the center of campus,
- the second floor of the Henry Madden Library adjacent to Starbucks,
- the second floor of the University Student Union, and
- a computer lab in the Peters Business Building.
The primary unit of analysis for these observations is the "session" — an approximately five-minute period during which the student researcher observes a person engaged in IT use. Observers also approached subjects for intercept interviews, in which researchers questioned subjects briefly about behaviors occurring in context. Overall, our efforts resulted in 393 intercept interviews.
Data processing and analysis included producing field notes from the observations and interviews, and using ATLAS.ti qualitative data analysis software to code and analyze the notes.
Analytical Categories
To systematically represent our students' naturally occurring behaviors, our initial observations gravitated toward classical sociology's action theory.5 Using this approach, we sought to describe the "work type" that students engaged in. Concomitantly, we used classical economic models of production and consumption to describe the "activity type." However, unlike classical economic theories — which describe production and consumption in relation to goods and services — we established an analytic framework that accommodates the production and consumption of knowledge, with guidance by Leon Cruickshank and Martyn Evans.6
So, the two categories of work type (schoolwork and non-schoolwork) and activity type (production and consumption) were the two largest distinguishing features of our many hours of observation. Whereas Cooley and colleagues relied upon "multitasking" as a means of representing the complex behavior of their subjects,7 we extracted the pattern codes of work type and activity type based on a grounded approach to our initial observations. We noted complex workflows that shifted emphasis between schoolwork/non-schoolwork and production/consumption and limited our coding to these dyads once we reached saturation of the codes' trustworthiness.8 For more on this, see "Intercept Interviews and Coding Procedure."
Intercept Interviews and Coding Procedure
At the end of a five-minute session observing a student using IT, our researchers approached the observed student and conducted a brief intercept interview. Each interview probed the research participant's type of work, activities, and array of devices at the time of the intercept. For each device in evidence, the researcher asked its mode of connectivity and its uses during the previous few minutes, including a quick inventory of the software, applications, and websites open and running.
The observational and intercept interview data reveal that there is much truth to the common impression that students often switch between devices and types of work (school vs. non-school) and activity (production vs. consumption). We call such behavior "switching" rather than "multitasking" because most activities are impossible to perform at precisely the same moment; students do not actually write a paper and compose and send a text message at the same time. Instead, they switch from texting to writing and back again, attending each activity in turn.
Although sessions were rife with switching and often defied easy categorization, some sessions were clearly more about one thing than another. For example, a session in which a student was writing a paper and sending a few texts to a friend was coded as dominated by production (typing the paper, texting) and schoolwork; the non-schoolwork texting was clearly present but not dominant. The main criteria we used to make such judgments in coding were the time spent on each task. In the preceding example, the amount of time spent on the paper was much greater than the time spent texting. When time on various tasks was unclear, we used intent as a secondary criteria. For example, if the time spent on schoolwork and non-schoolwork was either unclear or roughly the same, but the intent of the session was to accomplish schoolwork, we coded it as schoolwork.
Such analytical distinctions among sessions might seem arbitrary — and indeed, our distinctions were ultimately human constructs imposed on empirical observations. However, such distinctions are the bedrock of all scientific analysis. Reality is messy, and analysts must impose some order. The goal, then, is to make reasonable distinctions among phenomena, apply those distinctions consistently, and remember to understand the conclusions in light of our choices.
Activity Type: Production
We define production as any action that perturbs the digital world by creating a visible digital output or record of the user's actions. Examples of school-related production include:
- typing a paper,
- creating a post on Blackboard,
- doing homework on publisher-provided web tools such as MyMathLab or MasteringChemistry,
- emailing an instructor or classmate about a school-related topic,
- texting a classmate about a school-related topic,
- researching on the Madden Library website to find sources for a paper, and
- searching Google for a school-related purpose.
In the last two examples, the "production" consists of perturbing the digital world by entering search terms and creating temporary (personalized) lists. However, simply reading online articles acquired for a research paper would be considered consumption.
Examples of non-school-related production are:
- typing personal e-mails,
- non-school-related texting,
- editing a digital file (such as word processing, video, or audio) related to a hobby or other personal use,
- personal writing (such as blogging),
- social media use of any kind,
- playing a game,
- paying bills online, and
- online shopping.
In the last four examples, the "production" consists of perturbing the digital world by, for example, posting or "liking" a status update, manipulating digital objects in a game, or transferring money. We assume that social media usage and online shopping always result in perturbations (and hence production), even when we do not have direct evidence of such. However, merely researching products for a possible future purchase would be considered consumption.
Activity Type: Consumption
We define consumption as any action that does not leave a visible record of the user's actions (though other kinds of digital records might be left with websites, ISPs, and so on). Examples of school-related consumption are:
- watching a school-related video,
- listening to an audio lecture,
- reading a school-related article or e-book,
- looking up homework assignments on Blackboard, and
- looking up grades on MyFresnoState (our online student portal).
Examples of non-school-related consumption are:
- personal reading,
- watching a movie or other video content for personal entertainment,
- listening to music, and
- researching products for a possible future purchase.
Findings
By aggregating results for all the spaces, we can make some general statements about work, activity, and device use among students while on campus:
- The 760 sessions were nearly evenly split between those dominated by schoolwork (382) and non-schoolwork (378), but activity type was heavily weighted toward production (525, or 69 percent) over consumption (235, or 31 percent).
- Schoolwork tended to be more production-oriented than non-schoolwork. Of the 382 schoolwork sessions, 75 percent (288) were dominated by production and 25 percent (94) by consumption, while the percentages for the non-schoolwork sessions were 63 percent (237) and 37 percent (141), respectively.
- Finally, 61 percent (463) of the total sessions were dominated by laptop or desktop use, while 39 percent (297) were dominated by mobile devices (phone, tablet, or iPod Touch).
Although these summary findings provide an interesting snapshot of student IT use on campus, our concern lies with understanding the various uses of the spaces on our space–use continuum, and how these differences can help facility or IT managers program space to flexibly serve student and institutional needs. To that end, the following figures show the work, activity, and device type data by location.
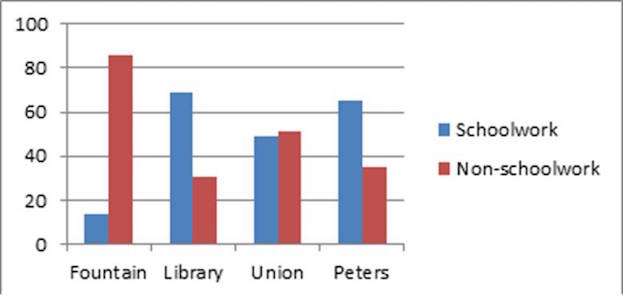
Figure 2. Work type by location (percentage)
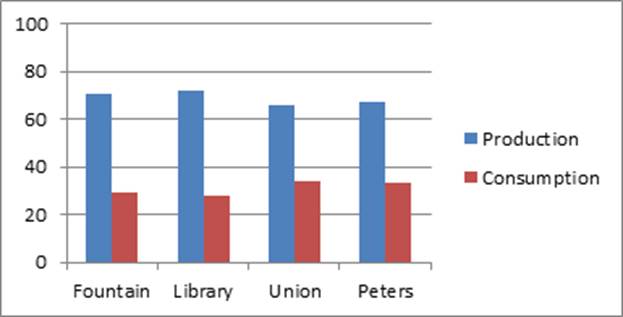
Figure 3. Activity type by location (percentage)
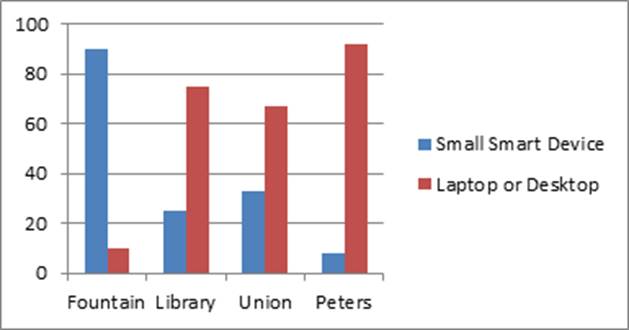
Figure 4. Device type by location (percentage)
Consumption Patterns
A total of 117 sessions with an accompanying intercept interview were coded as dominated by consumption. Table 1 shows the percentage of the session total for each location devoted to each consumption activity (for example, 30 percent of the consumption sessions at the fountain involved reading).
Table 1. Session consumption types by location*
| Location | Reading | Listening | Watching | Browsing |
|---|---|---|---|---|
| Fountain (n = 10) | 30% | 60% | 10% | 30% |
| Library (n = 37) | 65% | 5% | 24% | 32% |
| Union (n = 63) | 49% | 14% | 35% | 38% |
| Peters (n = 7) | 71% | 14% | 0% | 29% |
Figure 5 shows the same data as Table 1 for the library and student union (we excluded the fountain and Peters 131 as they had a relatively small number of sessions).
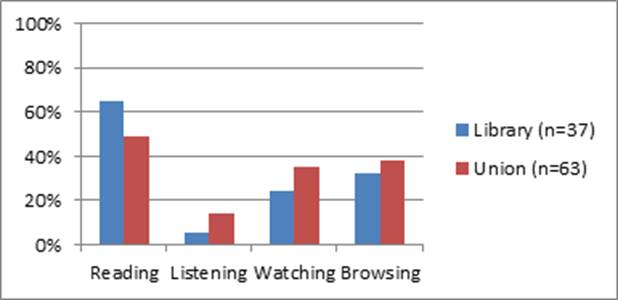
Figure 5. Session consumption type by location (percentage)
Production Patterns
We coded 256 sessions with an accompanying intercept interview as dominated by production; we then coded each of those sessions for the types of production observed. Table 2 shows the percentage of each location's total sessions by production activity; figure 6 graphically represents the table's library and student union data.
Table 2. Sessions by location and production type*
| Location | Writing a Paper or Editing a Document | Typing on Tablet, Laptop, or Desktop** | Pen and Paper Homework | Web Tools (Such as Blackboard or MyMathLab) | Online Research (Using Internal or External Sites) | Writing E-mail | Typing on Phone | Social Media | Gaming | Personal Errands/Non-School Activity |
|---|---|---|---|---|---|---|---|---|---|---|
| Fountain | 5% | 18% | 0% | 9% | 0% | 5% | 82% | 23% | 14% | 0% |
| Library | 24% | 69% | 23% | 30% | 13% | 6% | 22% | 27% | 1% | 3% |
| Union | 23% | 67% | 10% | 12% | 16% | 4% | 27% | 42% | 8% | 6% |
| Peters | 35% | 88% | 18% | 18% | 0% | 18% | 12% | 35% | 6% | 12% |
*Percentages exceed 100 because some sessions involved more than one production type.
** "Typing on tablet, laptop, or desktop" was used when the analysis was unable to determine exactly what the participant was typing; sessions coded for a specific activity (such as "writing a paper or editing a document") were not coded in this category.
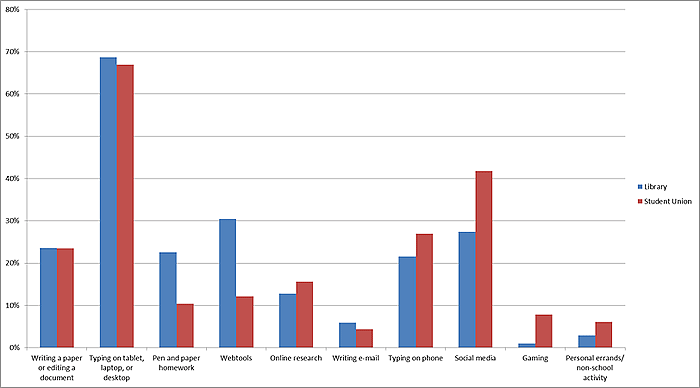
Figure 7. Library and student union sessions by production type
Narrative Comparison of Observed Spaces
The library's second floor (the space just outside Starbucks) and the Peters 131 computer lab were dominated by schoolwork, though students did a significant amount of non-schoolwork there as well (see figure 2). In the library, the dominant device was the laptop (see figure 4; there were no desktops in the library space we studied), while in Peters the lab-provided desktops dominated. Interestingly, schoolwork dominated a slightly higher percentage of sessions in the library (69 percent) than in the computer lab in Peters 131 (65 percent). These findings might seem counterintuitive if we assume that the area around Starbucks is a heavily social (non-school-related) space with a lot of "hanging out" going on. On the contrary, that space is the most dominated by schoolwork of all the spaces observed, including Peters 131. This finding seems consistent with our earlier research on student library use, in which students rated the library's ability to provide food and drink as an important element of its appeal.9 As one participant in our current study said, campus is the student's "home away from home," and students must satisfy their basic needs (including stimulants such as caffeine). Given this, the Starbucks-adjacent space on the library's second floor can be viewed as a successful design for facilitating students' academic work while on campus. Recognizing that students freely mix schoolwork with non-schoolwork, we see the library's second floor as a representative traditional study space.
The fountain area was dominated by non-schoolwork (see figure 2), with many sessions devoted to communication-type production for social reasons — such as texting friends and family — using mobile devices (mostly smartphones and cellphones; see figure 4). The fountain area is not conducive to laptop use: seating consists of wood and concrete benches, there are no outlets, and it is only partially shaded. A common posture of students observed in this space was leaning forward in a "hunkered down" position (usually using a smartphone), which was likely a response to both the absence of backrests and the need to shield devices from sunlight in order to read the screen. Despite such physical limitations, the fountain's role as personal space in the student IT space ecology must be valued for providing a convenient location for students to satisfy social needs that — while not schoolwork — are crucial to student life.
The student union is a flexible study space that lies roughly in the continuum's middle between the schoolwork-oriented spaces of the library and Peters and the fountain's personal space. In the union, we found a roughly even occurrence of non-schoolwork and schoolwork, with heavy use of laptops as well as desktops that the campus provided for that space.
Intriguingly, the production–consumption breakdown was roughly the same across all spaces (see figure 3). However, when we probed specific types of production and consumption, we found significant differences among the spaces. These findings helped support our existing characterization of the spaces.
Figure 5's consumption patterns show that when students use IT to consume in the library, they do more reading, while in the student union, they do more listening, watching, and web browsing. This pattern likely reflects the library's schoolwork-dominant nature and the union's more mixed, non-schoolwork-friendly environment.
Table 2 shows that some production activities are clearly more common in some spaces than others. For example, as the table's first two columns show, Peters had the most sessions devoted to typing, including typing papers and editing other kinds of documents. Peters also had a higher percentage of sessions devoted to writing e-mail compared to other locations. These findings make sense given the continued ergonomic utility of large keyboards and screens for producing text and other digital output. Production activity at the fountain was dominated by typing on phones, an activity that is relatively uncommon at the other locations; we know from the data that much of the fountain's phone-oriented production was texting.
If we focus on the library and student union (figure 6), the two most clearly comparable spaces, we also see some differences. For example, students did more pen and paper homework and web tool use in the library than in the student union, which likely reflects the dominance of school work in the library during sessions (69 percent) compared to the union (49 percent). The student union hosted more sessions devoted to social media, gaming, and personal errands than the library, a finding consistent with the relatively higher amount of non-schoolwork in the union (51 percent) compared to the library (31 percent).
Implications for Practice
What do the different points on the continuum imply in terms of IT infrastructure demands and other facility considerations? Table 3 presents a more detailed version of the space–use continuum we developed for our campus, with implications for facilities and IT planning practice. Once a space's place on the continuum has been identified based on students' observed behavior in the space, planners can bolster the features and services that facilitate students' work, activities, and goals in those specific spaces. (Currently, our campus is in the process of reviewing and implementing some of these recommendations in the specific spaces we studied.)
Table 3. Space–use continuum with facilities and IT implications
| Implications for Practice | Space Type | ||
|---|---|---|---|
|
| Traditional study space: schoolwork-oriented, academic production using laptops | Flexible study space: Schoolwork and non-schoolwork, production and consumption, mixed device types | Personal space: Non-schoolwork-oriented production |
| Facilities | Public squares with large tables or workspaces (with adjustable height where practical), with power built into furniture or easily accessible; task chairs or stools for computing and collaborating with multiple types of materials and devices | Flexible, adjustable collaboration break-out spaces for independent use, social gathering, or group work, with soft seating (such as booths or lounge seating with tablet arms); adjustable height tables on casters; easy access to power in furnishings or charging stations; perhaps stackable task chairs | Outdoor green rooms (typically popular gathering places) distinguished by a water feature or tree scape; ecologically sound seating; shade structures; adjacent spaces for food/beverages and backpacks |
| Technology | Wi-Fi, wireless printing, cloud storage, virtual software labs, access to online course materials, mobile help-desk support, e-mail and LMS support, e-librarians | Wi-Fi, wireless printing, cloud storage, mobile technology support services, flat-screen TVs | Wi-Fi and mobile apps for campus LMS and other popular services |
Production and consumption activity types provide a definition and clarity that helps facilities and technology planners design space and technology programming tailored for actual student usage. Additionally, as student technology use evolves, the continuum offers insight into flexible designs that can be modified over time with furnishings and technology enhancements.
Some implications for practice seem clear. For example, as figure 5 shows, in consumption sessions more students read in our traditional study space (the library) than in our flexible study space (the student union), which had a higher percentage of students who listened to music, watched videos, and browsed the web. On the production side, more students did pen and paper homework in the traditional space than in the flexible space (see figure 6). The data thus suggests that students in the traditional study space are spending more time doing traditional academic work such as reading, producing documents on their devices, and doing pen and paper work. These activities call for larger public-square–type tables with comfortable task chairs and adequate workspace for multiple devices, study materials, and personal items. Spaces adjacent to traditional study spaces should include access to ancillary services that provide "home base" amenities (such as food and drink).
The mixed-use nature of the flexible study space suggests the need for flexible furnishings that support multipurpose use including group socializing, collaboration, and independent work. Spaces such as the student union might entail short-term or long-term use depending on the activity; it is thus important to offer a mix of seating and table types to meet student expectations for both production and consumption activities. Student unions tend to offer many ancillary support services, but other campus spaces that are close to the flexible study space on the continuum might require examination to ensure the furnishings are robust and flexible for multiple student technology activities.
Outdoor green rooms are opportunities to create spaces that integrate unique features — such as water fountains, gardens, and "town square" gathering spaces — with students' needs to check in via technology. The green room in our study, the fountain area, was clearly a personal space. Tables and seating that are functional for a range of mobile devices and ecologically appropriate for outdoor climates are critical to support student personal space activities in green room areas. Although the continuum suggests that this type of space is primarily used for personal activity, it is important to recognize that some students might conduct academic activities, including the production of papers. With appropriate shade structures and flexible workspace, activities in this area can become more like those in flexible study spaces.
When examining technology needs, our planners will continue to enhance traditional academic spaces with evolving services that support student expectations for e-mobility and access. Planners should also consider student expectations for technology support within the continuum that transcends institutionally provided laptop/desktop stations to include more robust wireless access, printing, and cloud access from anywhere and with any device. In particular, students using traditional study spaces for consuming instructional content and producing academic documents will increasingly need wireless printing from multiple personal devices. Also, students might need personal support, such as through on-ground help-desk hubs, as well as online self-directed materials for critical areas such as the campus LMS, e-mail, and e-librarians. In our study, the flexible study space activities suggested that students expect access to wireless printing, mobile help-desk support, access to cloud storage, and larger flat-screen monitors or TVs for listening to and watching instructional and personal media. The outdoor personal space activities we observed suggested a need for readily available access to campus mobile apps and a range of tools that support personal activity such as games, apps, and social media.
Conclusion
Our space-use analysis and continuum provide a working model for our administration to develop budget and capital plans and priorities for facility renovations and technology requirements to meet short- and long-term needs. Renovations will remain a priority, as it becomes increasingly critical to retrofit existing facilities to adapt to students' consumption–production behaviors in pockets of spaces across the campus. Facility plans for retrofits or new construction will require architectural attention to creating spaces that can accommodate multiple production and consumption patterns, and furniture that can accommodate the proliferation of devices. It will also remain a priority to regularly participate in EDUCAUSE's annual ECAR student technology study and monitor changing trends that might impact space use, such as the rapidly growing use of tablets in teaching and learning.
We anticipate the need for ongoing, rigorous, and qualitative research to provide fine-grained detail about student work along the space–use continuum of our campus. The collaboration between academic researchers and administrators can help us effectively examine practices, backed by qualitative and quantitative data to enhance data-driven decision making in the rapidly changing world of student expectations and technology use on campus. These practices will inform facility, technology, and instructional design, which will in turn enhance high-impact practices that support our degree completion agenda.
- Joanna Bryant, Graham Matthews, and Graham Walton, "Academic Libraries and Social and Learning Space. A Case Study of Loughborough University Library," UK Journal of Librarianship and Information Science, vol. 41 (2009): 7–18.
- Charles Crook and Gemma Mitchell, "Ambience In Social Learning: Student Engagement With New Designs For Learning Spaces," Cambridge Journal of Education, vol. 42 (2012): 121–39.
- Christopher J. Cooley, Thomas Malaby, and David Stack, "How Are Students Actually Using IT? An Ethnographic Study," Research Bulletin, EDUCAUSE Center for Applied Research, November 29, 2011.
- Ibid.
- Talcott Parsons, The Structure of Social Action: A Study in Social Theory with Special Reference to a Group of Recent European Writers, Free Press, New York, 1968.
- Leon Cruickshank and Martyn Evans, "Media Communication, Consumption and Use: The Changing Role of the Designer," Undisciplined! Design Research Society Conference, Sheffield Hallam University, Sheffield, UK, 2009.
- Cooley, Malaby, and Stack, "How Are Students Actually Using IT?" 2011, 2 and 10,
- William Newton Suter, Introduction to Educational Research: A Critical Thinking Approach, 2nd edition, Sage Publications, Inc., California, 2012.
- Henry Delcore, James Mullooly, and Michael Scroggins, The Library Study at Fresno State, Institute for Public Anthropology, California State University, Fresno, 2009.
© 2014 Henry D. Delcore, Cynthia Teniente-Matson, and James Mullooly. The text of this EDUCAUSE Review online article is licensed under the Creative Commons Attribution-Noncommercial-No derivative works 3.0 license.