
Key Takeaways
- Giving students hands-on experience of field work with mobile tablet PCs loaded with visualization software facilitates active learning and integration of complex information and concepts.
- Combining class lectures with field experience aided students' mental modeling of the process of data-driven inquiry and increased the accuracy of their data collection and entry in the field.
- Experience over five years with three classes that used tablet PCs with GPS receivers in outdoor settings yielded greater student involvement and understanding of the course materials and scientific method.
"In our drive to educate our students for the real world by providing internships, undergraduate STEM research experiences, and high-tech opportunities for learning, such as Second Life and podcasts, we have somehow forgotten the educational potential of our backyards."1
— Cheryl B. Torsney, 2008
The 2011 Horizon Report places mobile devices as a top technology to watch for in the coming year.2 Our article focuses on mobile computing with a tablet PC, drawing from over five years of experience teaching with tablets in outdoor, field-based classes. We discuss three classes — Environmental Science, Ecology, and Biology — in which we tap the "educational potential of our backyards."
Computing in the Field
Loading mobile tablet PCs with scientific visualization software, classes can be taught outside, field methods demonstrated, and data collected in real time using the tablet's stylus or pen. The technology of mobile computing has broad application in the field sciences.3 In the field and in the geographic context, patterns emerge and are observed, such as a change in soil-type coinciding with a marked change in vegetation, and data can be reliably verified without waiting to go to a computer lab.4 This active learning, where students are engaged in a task, exercise, or research question, allows learners to be better able to understand complex relationships and apply what they have learned in other settings and contexts,5 and using tablet PCs enhances and provides advantages, such as teaching about and improving the scientific method, in this learning environment. Working on a research-based problem, especially one with longitudinal data, provides students an opportunity to interpret findings and integrate information.6
Pen-enabled data collection on mobile tablets is used extensively in medicine, law enforcement, warehouses, shipment tracking, academic research, and many other areas. We expect tablet PCs will improve substantially as those industries, as well as higher educators, push the margins of use and manufacturers refine and perfect the technology. Pen-based or touch-sensitive computing will only get better, and we are eager to see the new models of tablet devices.7
In this article we discuss three courses taught at three colleges. Each course is treated as a vignette from the point of view of a faculty member and a technology specialist. Though the courses are similar in that students use a tablet PC outdoors, the exercises and assignments, learning outcomes, faculty member's goals, and length of time using a tablet for class work all differ. In addition, student survey questions were not equivalent. The classes use standard off-the-shelf software or freeware, typically on Windows-based desktop machines. The pen-enabled tablet allows easy on-screen annotation and note-taking, and the software used has built-in digital inking capability. Our goal is to provide a wide-angle view of how to use tablet PCs as a mobile data-collection and note-taking tool suitable for students' use in the field. We hope to encourage a flowering of creative ideas for using tablet PCs in other classes having an outdoor component.
Example 1: Environmental Science
Introduction to Environmental Science (ENST 150)
Number of students: 50–60
Hardware: HP tablet PCs (not ruggedized), GlobalSat USB/Bluetooth GPS receiver
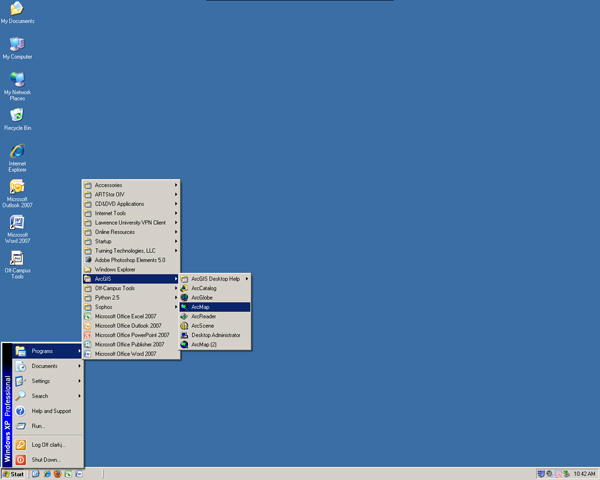
Software: ESRI's ArcGIS, Microsoft Office
Course prep time: 5 hours per week for lab
Technologist support during class: a trained TA for every lab
About the Course
The Introduction to Environmental Science (ENST 150) course taught at Lawrence University (redesigned in 2008 to include a laboratory component) serves approximately 60 students, subdivided into three-hour lab sections of 20 students. It primarily serves roughly equal numbers of under- and upper-class students seeking to satisfy their lab-science requirement, but is also the gateway course into the Environmental Studies major. Because of the diverse enrollment, the main learning outcome we tried to achieve was proficiency in collection and analysis of data, especially geospatial data.
The laboratory component consists of two sets of paired exercises (four exercises total). Two exercises focus on the development of relevant technology skills, such as using ArcGIS and a GPS receiver to collect and analyze field data. (Figure 1 shows students preparing for field work with a tablet PC, an attached GPS receiver — noted by the yellow circle above the student wearing a cap — and other data-collection devices.) These "tech skills" exercises are paired with "application"-type exercises where students use the tools to analyze environmental data. The application portion reinforces the technology skills and employs them to answer relevant questions in environmental science. For example, in the first pairing, students learn how to collect, add attributes to, and analyze point data. The application portion asks students to map water quality parameters through an urban stream setting. The skill portion of the second pairing teaches students spatial analysis tools such as interpolation and contouring. These skills are then used to map lead contamination of urban soils (see Figure 2, an interpolated map of soil lead concentrations around Appleton prepared by students in spring 2009), which leads to hypothesis formulation on the sources of contamination and ultimately suggestions for mitigation. Details of these activities include handouts; instructor notes can be found at Outdoor Classroom Activities,part of the Faculty Career Enhancement Project.
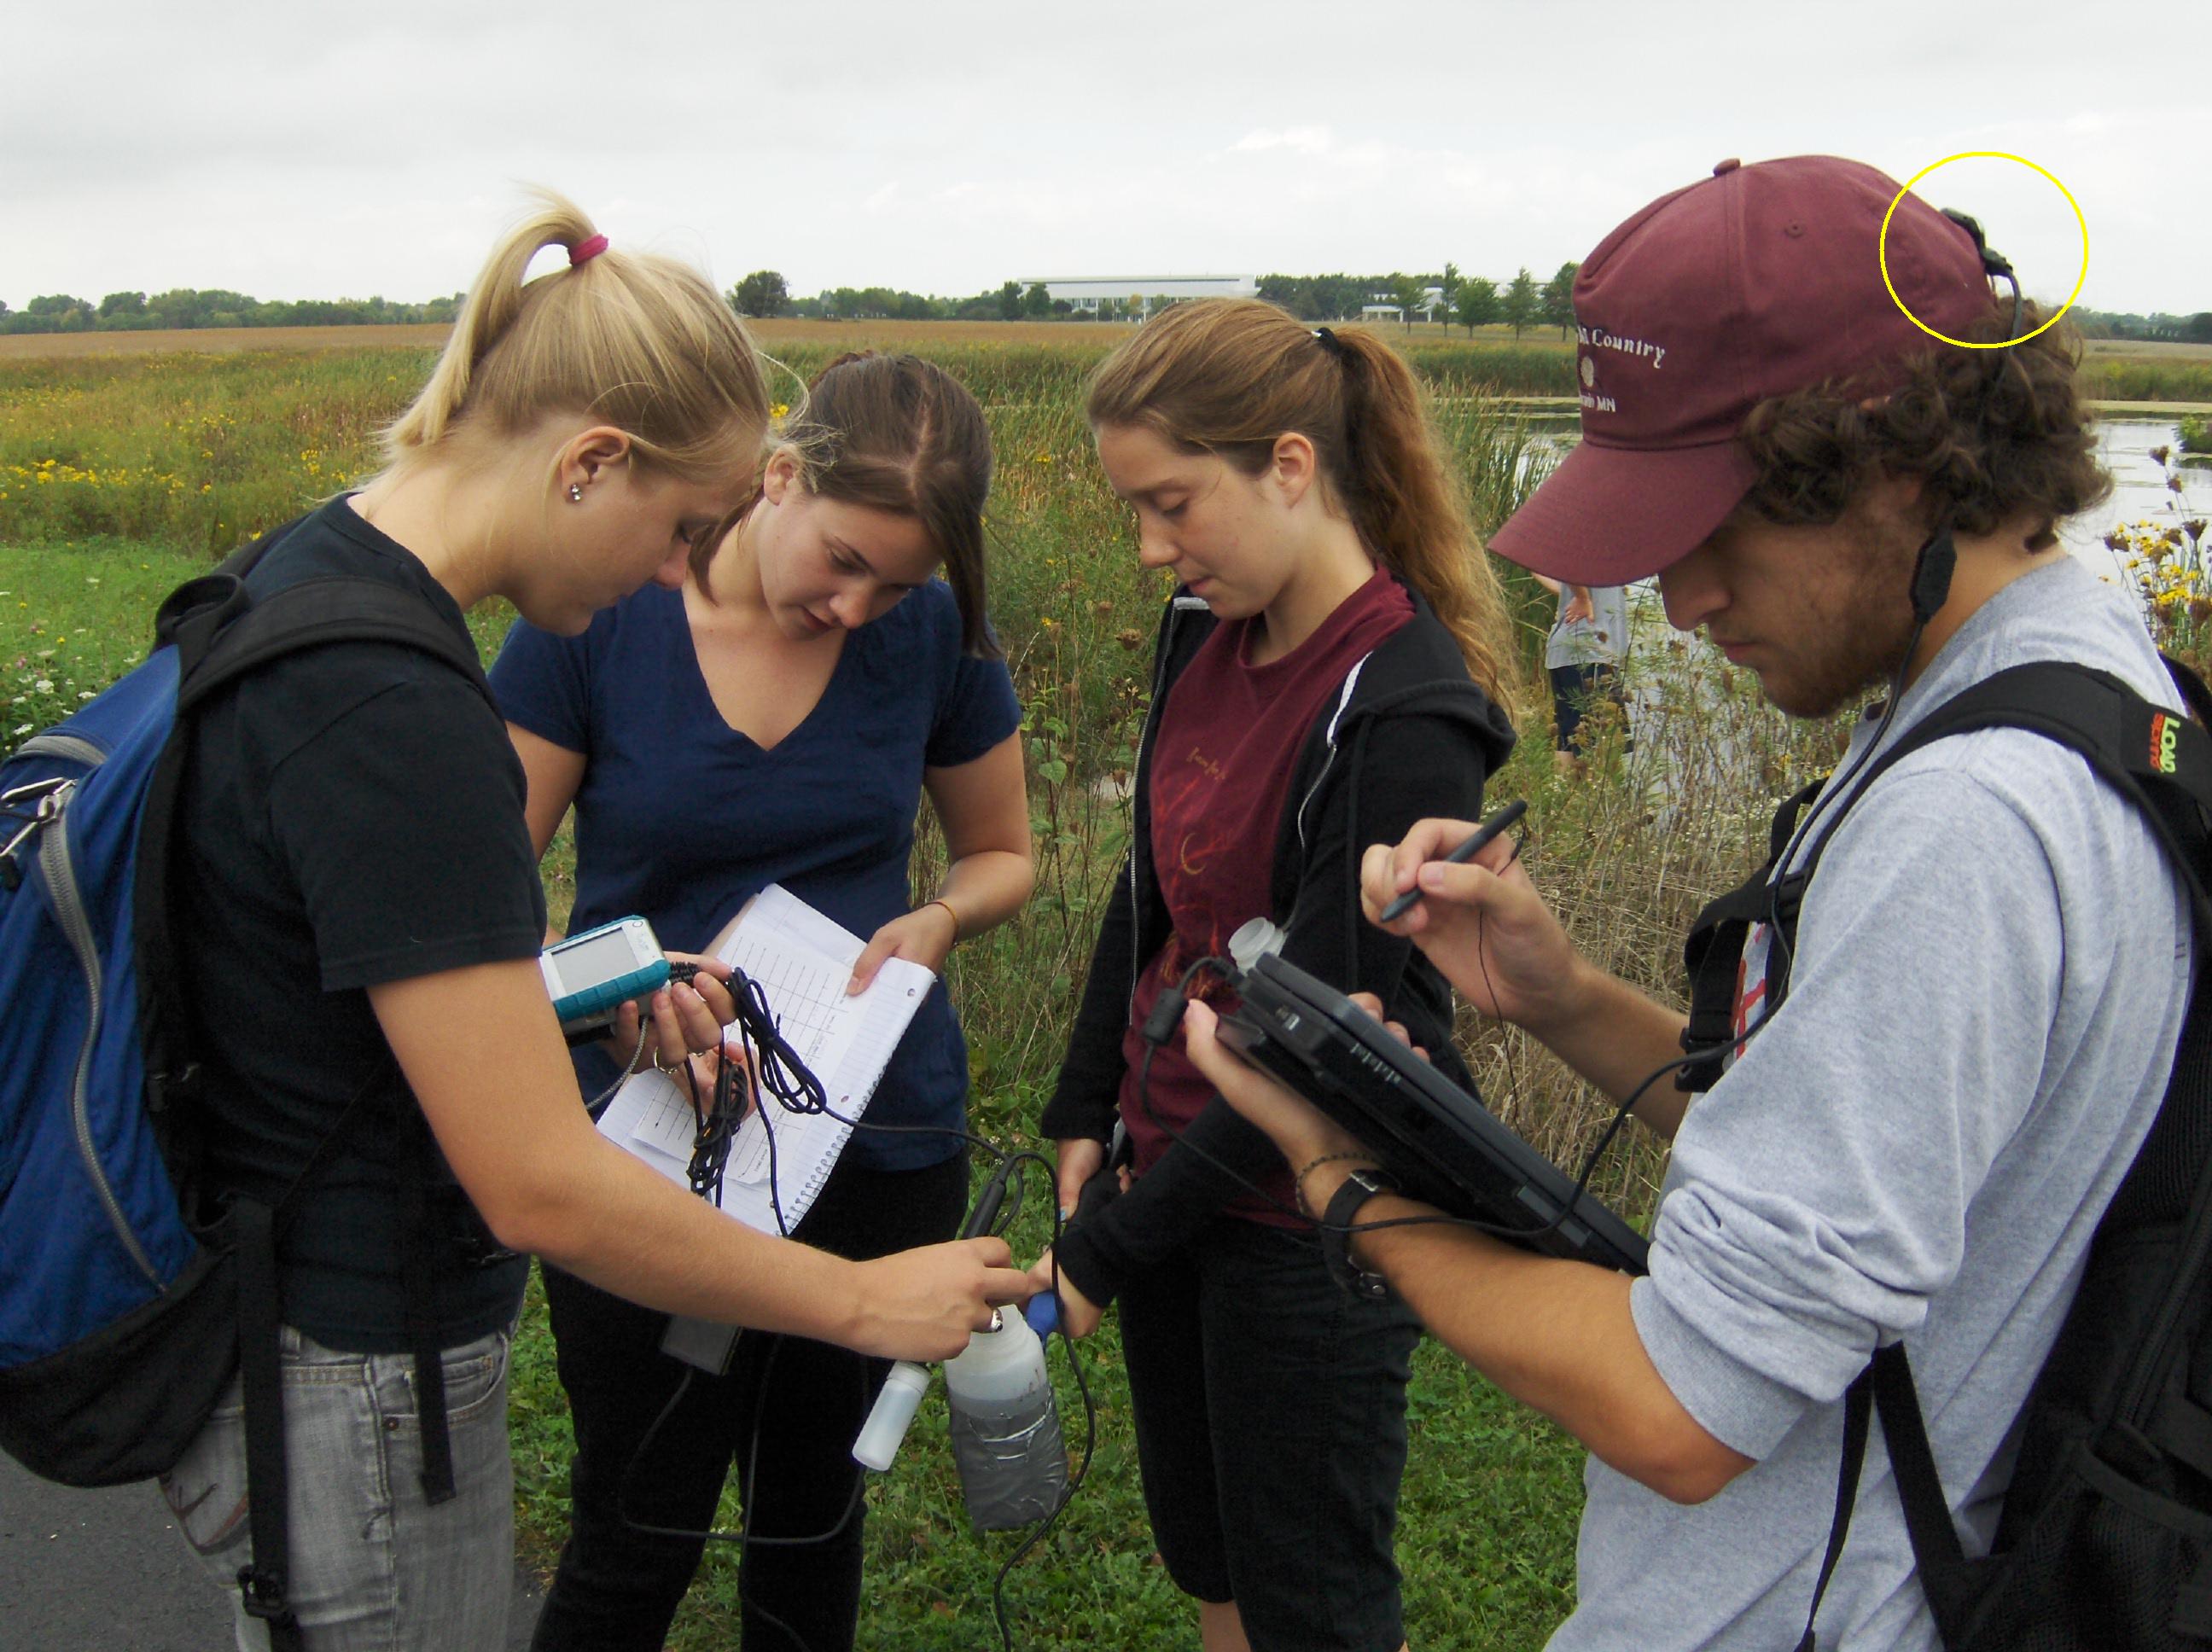
Figure 1. Students Preparing for Field Work with Data-Collection Devices
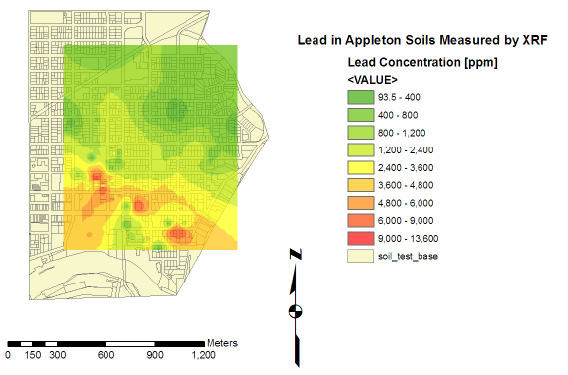
Figure 2. Map of Soil Lead Concentrations Around Appleton, Wisconsin
Prepared by ENST 150 Class in Spring 2009.
This tutorial video shows students how to use a tablet PC and a GPS receiver with ArcGIS software to collect locations:
Course Evaluation
To evaluate achievement of learning goals in the Introduction to Environmental Science course, we administered pre- and post-course questionnaires. The responses were on a Lickert scale of 1 to 5 where 1 = strongly disagree and 5 = strongly agree. All differences were statistically significant at the p < 0.05 level except for question 3 (Table 1).
Table 1. Results of Pre- and Post-Course Survey in ENST 150
Survey Question | Pre-Course Average (n = 46) | Post-Course Average (n = 54) |
| 1. I can write a lab report. | 3.37 | 4.15 |
| 2. I can use graphs to show what I found out in my experiment. | 3.98 | 4.31 |
| 3. It is hard for me to look at the results of an experiment and tell what they mean. | 2.61 | 2.26 |
| 4. I can use maps to show spatial patterns. | 2.85 | 4.1 |
| 5. I can design an experiment to test my ideas. | 3.33 | 3.76 |
| 6. I can read and interpret geospatial data. | 2.46 | 3.81 |
| 7. I have a good idea of the abilities and limitations of GIS. | 2.28 | 3.69 |
| 8. I have a good feel for scientific uncertainty. | 3.17 | 3.80 |
| 9. I can make and use conceptual models of the environment. | 2.89 | 3.63 |
In the pre- versus post-course survey students felt that they improved their general scientific and quantitative skills such as creating conceptual models (Q9), preparing lab reports (Q1), interpreting experimental results (Q3, p<0.1), designing experiments (Q5), and using graphs to analyze data (Q2). Moreover, students significantly improved their perceived skill and understanding of geospatial analysis, including making and interpreting maps (Q4 and Q6) and knowing what the functions, uses, and limitations of a GIS (Q7).
Our evaluation of student work corroborates these data. On the first exam, which covered course content and the first two labs, the class average was around 65 percent. After two more labs the class performance improved to an average of around 78 percent. Scores on labs also generally improved, with early lab scores in the low 70s and later lab scores in the upper 80s. Overall, students improved their proficiency in collecting and analyzing environmental data and geospatial patterns.
Reflections and Lessons Learned
The tablet PCs used in these activities serve primarily as location-aware digital field notebooks. Students mark a sample location (using a GPS and aerial photograph as a base map) and add in-situ attributes. For example, students measure temperature, pH, dissolved oxygen, and conductivity in the field and enter those data into the GIS (see Figure 1). Of course, the geodatabase and relevant attribute fields must be set up in advance, which adds to instructor and technologist course prep time. Students can then —via a simple color coding of temperature, for example — see spatial trends and ask questions about why those trends exist. They can then make additional observations while still in the field.
An extension of this "real-time" data analysis is to identify spatial gaps in the data that can be rectified by additional collection before returning to campus. In effect the initial data collected, once analyzed, inform a new strategy for additional data collection. The activities must be constructed and lab time allocated, however, to allow and encourage this reflection. This can be challenging in a three-hour lab.
Though we believe the implementation of tablet PCs into our course was successful and worthwhile, it was not without cost. Problems can come from the hardware (the tablets, GPS, wireless), software (tablet OS, ArcGIS, security/access issues), and, of course, the novice end user. Although several test runs vetted the exercises in the field and students receive detailed step-by-step instructions, many problems do not emerge until 20 students are using the mobile devices at once. For example, when going from laptop mode to tablet mode the screen orientation changes, hiding some of the tool bars and changing the display scale. If students do not know how to reset the orientation, they cannot find the proper tools. Now that the most common problems with using the tablet PCs have been identified, many can be rectified quickly in the field by an instructor or a well-trained TA.
Students can be seduced by the glamour of technology but are also very intolerant of glitches — even those that arise through their own actions. Though many appreciated having a fully functional computer with the standard Microsoft Office suite of software, few took full advantage of the capabilities. Most students, it seems, are still more comfortable using paper and pencil in the field, and unless a tablet PC is required for a particular activity, they choose to leave them behind. On one occasion, for example, students had the option of using either pen and paper or the tablets to collect notes. All but one group (two out of 20 students) elected to use a paper notebook. They left the tablets behind because of their bulk, difficulty in viewing the screens outdoors, and fear of breakage. In the three years that we've run the lab, with over 150 students handling the machines, we have yet to damage one in the field, even in light rain, where a simple 2.5 gallon plastic bag keeps them dry enough (see Figure 3).
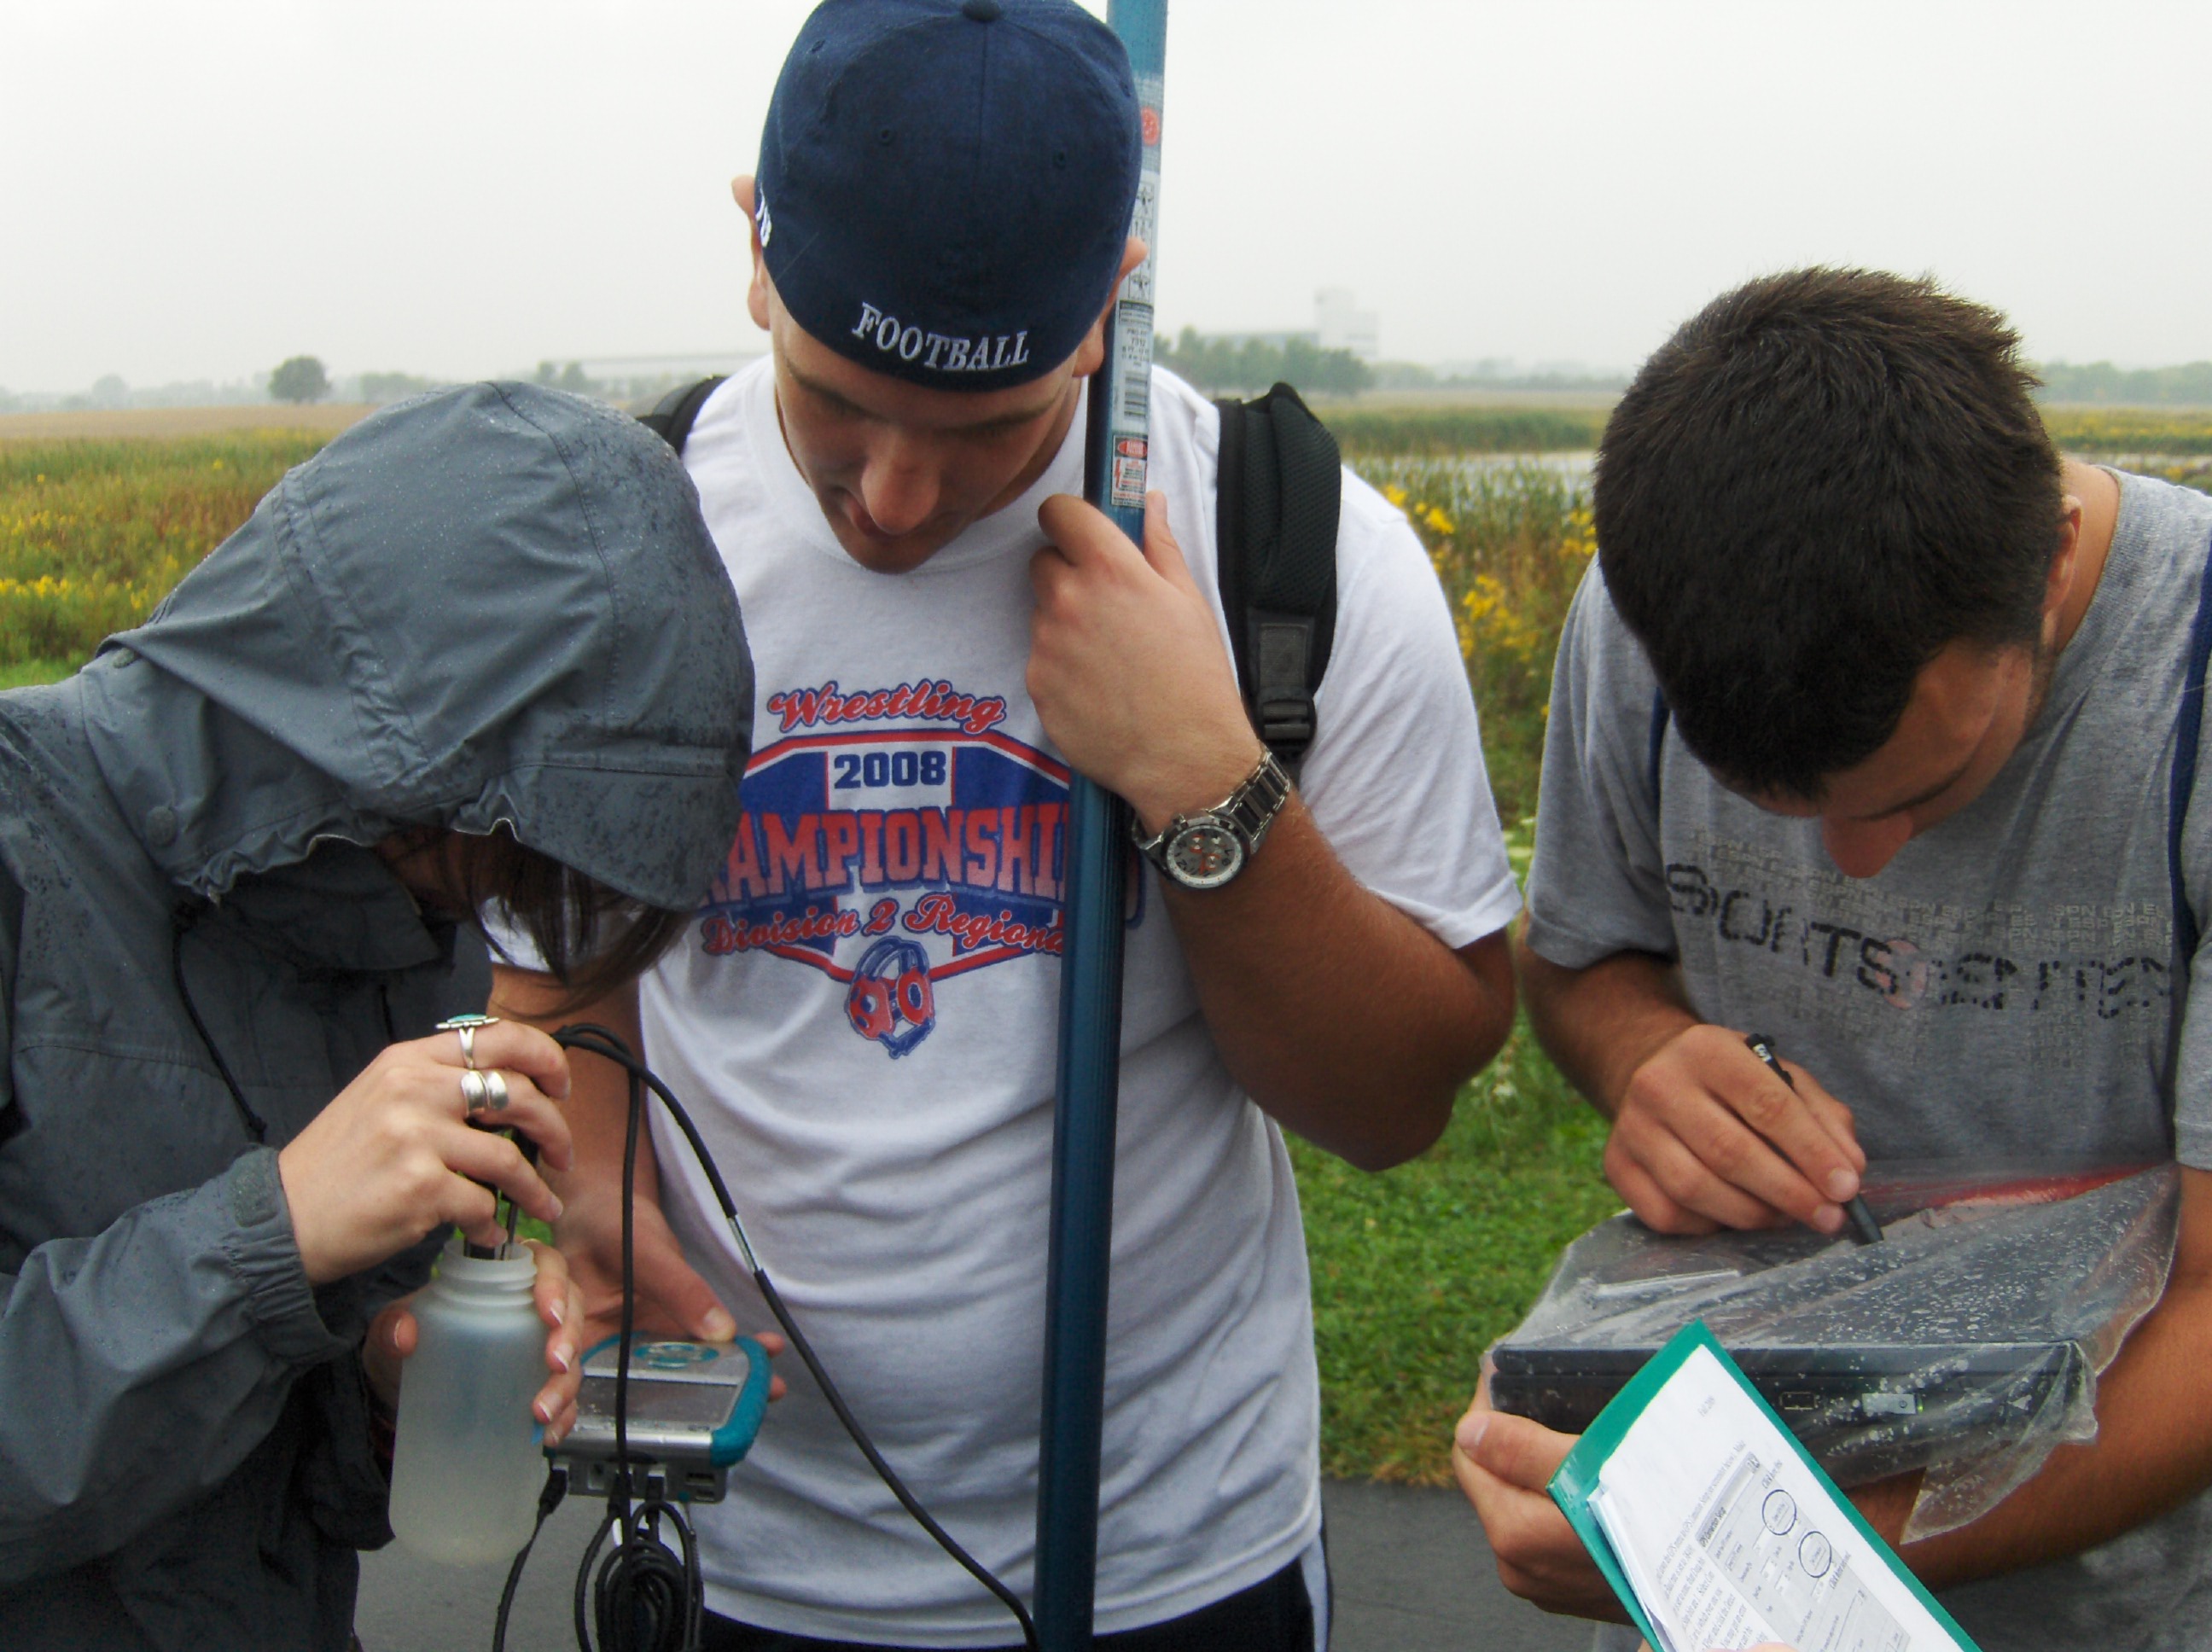
Figure 3. Collecting Data with Plastic Bag–Covered Tablet PC
Example 2: Ecology
Ecology (BIOL 200)
Number of students: 22
Hardware: IBM tablet PCs, field case for carrying table PC
Software: Photogrid, Microsoft Office Suite, web browser
Course prep time: 18 hours for three lab periods
Technologist support during class: two technicians on all field days
About the Course
Ecology, a 200-level course offered through the Vassar College Biology department, welcomes students from all majors, although class size is limited to 22 students. The course looks at population growth, plant species interaction, and community patterns of species or groups of species. Within a framework of evolutionary theory we take advantage of local habitats and organisms as examples for studying interactions between plant organisms distributed in space and time.
Estimating plant coverage over a given area is a technique biologists frequently use in studying plant distribution, but the results can be subjective and vary by individual. We wanted to reduce bias and increase accuracy by bringing tablet PCs into the field for on-the-spot data collection and entry. Students in the field thus share a tablet PC while working in pairs.
In 2006, 20 permanent experimental plots were set up at a nearby ecological preserve and randomly assigned to be either control or removal treatment plots. From 2006 through 2009, the Ecology class used tablet PCs to collect data for a long-term invasive species study at the preserve. Students examined how the invasive garlic mustard(Alliaria petiolata) affects the diversity, distribution, and survival of other plants.
The following video provides a brief explanation of the Ecology class and how we use tablet PCs:
Every year in the early spring student employees remove all garlic mustardplants from the removal plots. Prior to each year's lab module, staff and student assistants photographed each plot. They loaded the pictures and a site-specific plant identification guide that could be accessed offline via a web browser onto the tablet PCs. Using free software called Photogrid, designed to aid in ecological photographic interpretation, students analyzed photographs of field plots by identifying the species beneath randomly selected points.
Figure 4 shows students identifying plant species in a square meter experimental plot as part of the invasive species study. They use the plant identification guide on the tablet PC and Photogrid software to randomly sample the plot.
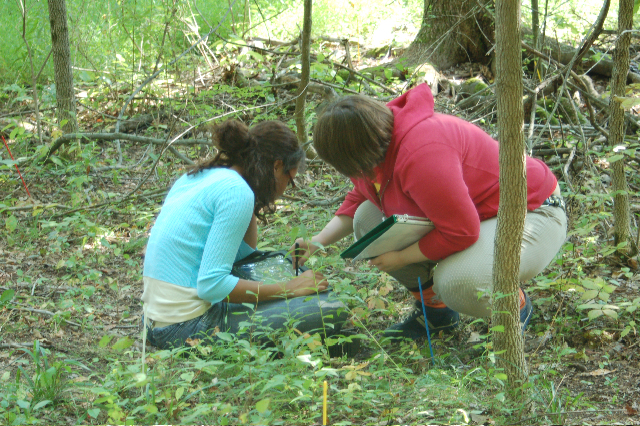
Figure 4. Ecology Students Identifying Plant Species
The following video explains how the freeware Photogrid and the plant identification chart are used for this field work:
Course Evaluation
Over two separate semesters of the Ecology course (fall 2006 and fall 2007), we conducted evaluation through the use of pre- and post-course question sheets, collected anecdotal evidence, gathered written student comments, and made in-class observations. Our surveys looked at learner attitudes and confidence level. We gave the students a pre-course questionnaire on the first day of class and ended with a post-course questionnaire using a Lickert scale (1 = strongly disagree, 3 = neutral, 5 = strongly agree) to measure attitude and confidence changes after completing the course.
Table 2 shows the questions we asked on the post-course questionnaire to get a sense of how the students felt after taking Ecology and the percentage of positive agreement (only answers of 4s and 5s), totaled and averaged for both semesters. Fifteen students responded to the survey.
Table 2. Results of Post-Course Survey in BIOL 200
| Survey Question | Agreement with Question (n = 15) |
| 1. I am confident in my technical background. | 73% |
| 2. I have a solid background which will allow me to learn new technologies in the ecology field. | 80% |
| 3. I see value in working in a team and collaborating with other students on different tasks. | 87% |
| 4. I see value in working in a team with students from another discipline. | 73% |
| 5. I enjoy using technology in my work and play. | 67% |
| 6. I understand the role that technology plays in ecology. | 93% |
| 7. I feel confident in my abilities to enter the ecology field. | 80% |
| 8. I developed specific field skills in this course. | 73% |
| 9. I have learned to synthesize and apply what I have learned from lecture in the field. | 93% |
| 10. I have gained critical thinking skills through this course (e.g., ability to evaluate different field methods, apply them to different situations). | 67% |
| 11. Applying techniques we learned in lecture in the field was valuable to me. | 67% |
| 12. Using technology in the course (tablet PCs, scientific software) was valuable to me. | 80% |
Students returned strongly favorable responses on nearly all questions related to their attitude toward technology and science and questions about their confidence level. In particular students see value in working in teams (Q3), feel strong in their ability to synthesize and apply knowledge from lecture to field work (Q9), and see the link between technology and the field of ecology (Q6). Given findings from a recent ECAR study on students' perceived technological shortcomings following graduation, where fewer than half of the student respondents felt confident in their technical abilities to enter the workforce,8 we are pleased that 80 percent of our students feel prepared to enter the field of ecology (Q7).
We also collected written feedback from the students at the end of the courses, asking them three targeted questions (12 of the 15 students wrote comments). A subset of representative comments, in each student's words, follows. A complete list of student responses can be found here.
Q. What is the most important skill you developed in this course? Why do you think this skill is important?
- "Learning how to take measurements in the field was crucial to the Garlic Mustard portion of this course. Knowing how to actually work in the field is crucial to the study of Ecology since this is the only way to see how different communities actually work."
- "Probably the most important skill I learned was efficiently identifying plant species. I learned a lot in lecture about ecological concepts and processes, but it was useful to also gain some familiarity with actual species in the environment around me."
Q. What role do you believe technology plays in ecology? Provide an example in which technology is helpful in ecological studies.
- "I feel that it is extremely import — the tablets w/ Photogrid allowed a much more uniform method for data collection rather than having to ID plants/data pts from a regular picture/drawing."
- "It is a helpful aid in eliminating data entry to a one time only thing, which is nice!"
Q. What factors do you need to consider when supporting uses on tablet PCs?
- "User background w/ technology."
- "The batteries will die at some point so back up your work!"
- "A demonstration would be helpful to make sure that all students know how to use it."
Reflections and Lessons Learned
The students communicated that the field component of the class especially helped them develop a deeper understanding of invasive species. Because we took the students into the field and had them actively engage in data collection for the project and draw inferences from results they derived, we believe they built on the lecture content and gained more understanding of the concept of invasive plant species in the environment affecting forest understory.
The students estimated the dominance of vegetation by determining the percentage of points that fell on each species. This eliminated errors due to differences in the perception of coverage because students identified a series of points rather than estimating area. Although some rare individual plants might have been overlooked if a point did not land on the plant in the photograph, using the tablet PCs allowed us to assess the teams' accuracy. Data could be checked and recalculated when inaccurate data were detected. Although time consuming, this allowed us to have confidence in the accuracy of the data that the students collected.
Because the students had access to a localized plant identification chart as well as Photogrid software and a spreadsheet program while they were collecting their findings in the field, they did not need to come back to a desktop computer lab and reenter their data — the data were already in a digital format and ready for analysis. The method of using a tablet PC and standard scientific data analysis software while in a field setting clearly decreases time spent collecting and analyzing field data.
Tablet PCs are an important tool that can provide both the student and instructor with new opportunities. The mobility of the tablets allowed us to integrate invasive species research into an Ecology lab module by:
- Increasing the accuracy of the data that students could collect
- Simplifying plant identification by creating a site-specific guide
- Saving time by eliminating data entry in the lab
We encountered few challenges in getting students to use the technology effectively. However, the slow speed of the tablet PCs often led to frustration within the student groups, which they transferred to the instructors. Impatient students might not have waited for the field guide pages to load, which could have led to the errors seen in data collected by some groups. Students often complained about the loading time of the images on Photogrid as well. From our experience, the greatest limitation of using the tablet PC in the class was the quality of the machines themselves. In the future, we expect that improvements in the technology will eliminate most of the challenges we faced with these mobile devices.
Overall, we felt that the use of the tablet PCs in the Ecology class field research was a success. We have already begun to use the tablets for other research projects as a consequence.
Example 3: Biology
Methods of Biological Problem Solving (BIOL 1212) and Ecology (BIOL 3434)
Number of students: six sections of 25 students each (BIOL 1212); enrolment varies (BIOL 3434)
Hardware: HP tablet PCs (not ruggedized), DeLorme USB GPS receiver, and Serial Emulator
Software: ArcGIS, Microsoft Excel
Course prep time: 40 hours to write initial curriculum, with 2–4 hours data processing time each semester
Technologist support during class: For BIOL 1212, heavy support during first two semesters; in later semesters, faculty required less in-class support and were well served by a two-hour technology refresher workshop prior to the labs. For BIOL 3434, technology liaison present during all GIS-related field work.
About the Courses
In 2008, members of Trinity University's Biology department designed or redesigned components of several courses to capitalize on the capabilities of tablet PCs equipped with both standard and specialized software. Intended outcomes for deploying the tablets as teaching and learning tools included increasing active learning experiences for students while providing teaching faculty with an opportunity to experiment with technology as a teaching tool. Although technical limitations and performance issues frustrated faculty and students alike, the inclusion of the tablet PCs was generally seen as a positive contribution to student learning and engagement as well as to faculty efforts toward teaching with technology.
Initially, the tablet PCs allowed adding a field component to a two-week lab module in a lower division biology course, Methods of Biological Problem Solving (BIOL 1212). Prior to the acquisition of the tablet PCs, this lab module had consisted of a single week of desktop computing devoted to proximity analysis, using ArcGIS software and prepared data sets and base layers. Students confronted an ecological problem — a habitat/land use conflict involving data points representing individual trees of various species and habitat requirements of the golden-cheeked warbler — that required a spatial auto-correlation analysis to render a solution. This learning design provided a degree of practical context (a documented problem presented realistically) and interactivity (the learning design required discussion and collective decision-making at the introduction of each new concept and during the evaluation of results). Student engagement, as observed by instructors, was cursory, however, and the lack of authenticity (visiting the site and personally recording observations) resulted in diminished perceived value for the module, as expressed by students in end-of-term course evaluations.
In an effort to directly achieve the department's goals of facilitating a cognitively active learning experience where — following Richard Mayer's model9 — students actively construct new understandings by selecting new information, organizing it into mental models, and integrating those models with prior knowledge, the lab was revised to use student-gathered tree location data as the basis for analysis. The existing activity was modified to provide both concept introduction and technology and methodology instruction. In the redesigned version of BIOL 1212, students recorded campus tree locations, attributes, and notes using the tablet PC in combination with a GPS receiver. The tablet stylus was used in combination with a data entry form custom programmed into the GIS software interface (see Figure 5).
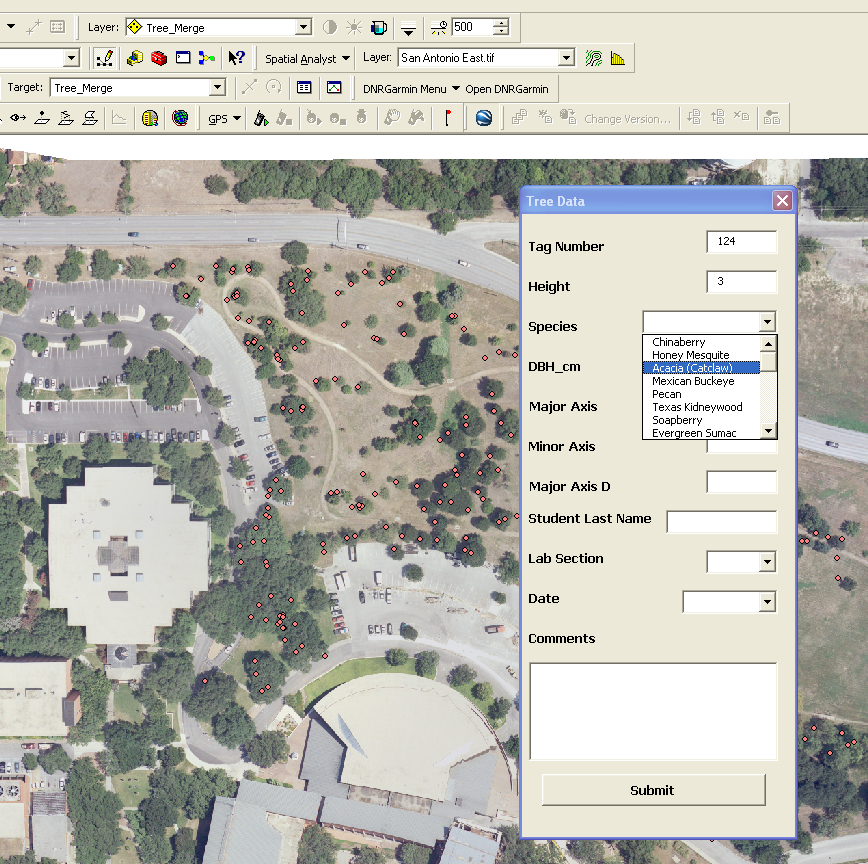
Figure 5. Campus Tree Map File with Custom Data Form
Assignment descriptions and photos related to the BIOL 1212 tree lab can be found on the project website.
In an upper-division course, Ecology (BIOL 3434), nine students completed life tables using data on date of birth and death date gathered with the tablets in a local cemetery (Figure 6). Again, GPS receivers connected to ArcGIS software and a custom form designed to function with the tablet stylus provided a manageable process for data entry (similar to Figure 5). Students then used the tablet PCs to visualize their data with Excel and completed various proximity analyses using ArcGIS. Students were introduced to ArcGIS by using the tablet PCs to complete a suite of tutorials, and they received additional instructions in their lab handouts.
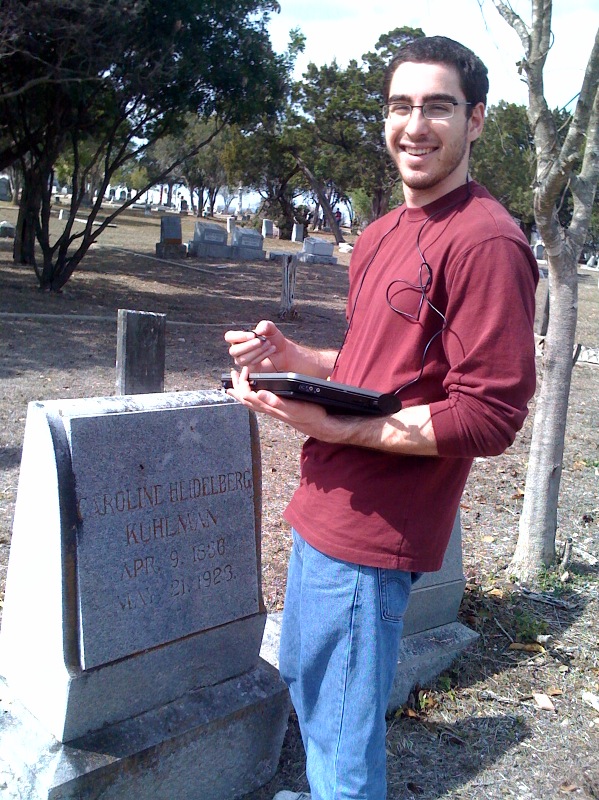
Figure 6. Trinity Student Brian Malpede Using a Tablet PC for the Life Tables Ecology Project
Assignment details and student work from the life tables project also can be viewed at the project website.
Course Evaluation
There were noticeable differences between the earlier version of the BIOL 1212 module and the redesigned course using an active learning model of outdoor education. Using the mobile technology led to some new procedural complications (such as problems with tablet battery life and screen brightness), but it also led to a clear increase in student curiosity. Faculty observed that students asked more questions about how particular attributes would be used in spatial analysis than they had when studying prepared data in previous versions of the module. Students also reportedly mused on potential research questions in the field while watching the map-based visualization of their tree data grow as they added points, lending an instantaneous element to their attempts to reconcile theoretical knowledge with observed phenomena. This anecdotal evidence suggests that having the tablet PCs in the field provided an apparent aid to students' mental modeling of this process of data-driven inquiry.
We collected written responses concerning the BIOL 3434 student observations and comfort level with the newly introduced technology. The following quotes represent some of their thoughts:
"They were definitely useful in the field and laboratory, and good to use for the relevant programs and data collection and analysis."
"Helped doing GIS in the field."
"They were useful in using GIS in the field and recording info, although they were often time-consuming because they were so slow."
"They are a good resource."
"They need to boot up faster!"
Reflections and Lessons Learned
As in BIOL 1212, the tablet PCs were a boon in BIOL 3434 for incorporating data visualization and the formulation of research questions into the experience of gathering data in the field. In evaluating students' use of spatial analysis results in their final assignment in Ecology, the instructor noted:
"The initial results indicated students were incorporating spatial information better than previous years."
The tablet PCs' touch screens worked particularly well with customizations to the GIS software interface, allowing students to enter observed values in situ with pop-up entry forms tailored to their data requirements. Additionally, students found that using the same software (ArcGIS, Excel) for data entry, visualization, and computational analysis resulted in faster development of their concept understanding and task proficiency, which in turn provided more time for critical reflection and fine-tuning of methodologies.
Additionally, the computing power of the tablet PCs combined with the authentic nature of the field work allowed students, in each of the two cases described above, to work toward a common data set, giving them the experience of creating a collective resource for analysis and subsequent decision making. Compared with previous, lab-based versions of these assignments, this authenticity and shared responsibility contributed substantially to student and faculty engagement with the assignments, leading to greater care in the observation and measurement of field data and likewise to more rigorous adherence to lab procedures when processing and analyzing the data and discussing its implications.
Technical problems related to network connectivity, processing speed, and interaction with peripheral GPS devices presented disruptive yet modest obstructions to easy adoption by students and faculty alike, and underscore the need for coordinated technology support at both the classroom and network level. Narrative feedback indicated that, left unaddressed, technological glitches could discourage further experimentation by teaching faculty.
Faculty Development and Mobile Computing Experiences
To introduce interested teaching staff to using a tablet PC for field studies, two faculty members and a technologist at Vassar College gave workshops on how to use the mobile computer for outdoor studies. This workshop, held over a half day on campus, gave significant exposure to professors from any discipline doing outdoor, place-based research and teaching. Figure 7 shows the workshop's two stages: (a) in-classroom instruction familiarizing faculty with the mobile device, and (b) outdoor work with tablet PCs and GPS receivers attached through the USB port. For more information about Vassar's tablet PC experience, please see the project website.
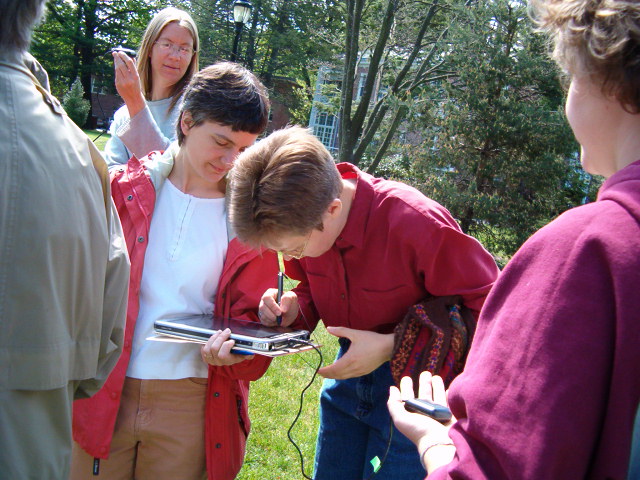
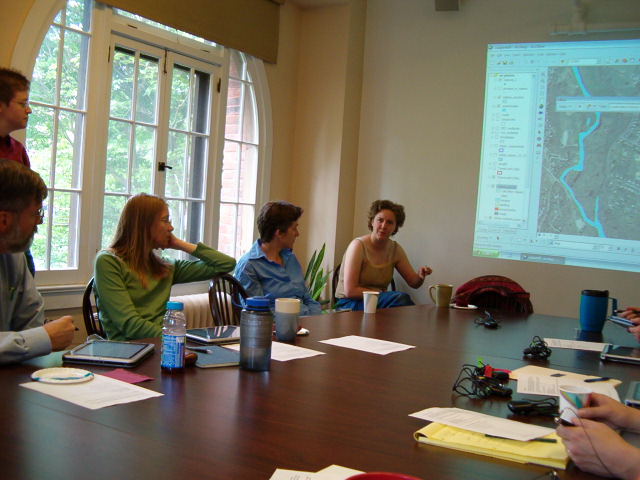
Figure 7. Tablet PC Faculty Development Workshop at Vassar: (a) In-Classroom Instruction and (b) Outdoor Work with Tablet PCs and GPS Receivers
In surveying faculty members at Trinity University and Vassar College regarding the value of the tablet PCs, some professors clearly find the use of mobile technology an asset for their students and in their research projects:
"I used the tablets with my research students working in the field, which allowed us to keep updated compilations of field data in spreadsheet form."
"They're such small units, they're very non-intrusive, they have good battery life, you can take it and do any sort of primary data collection research."
"Knowing how to use technology to collect rigorous and meaningful data is an essential tool that helps students become knowledgeable scientists, or to become critical consumers of science."
"… students are getting exposed to the kind of technology that they're going to be using as professionals if they go on to a career in earth sciences."
When faculty members on our campuses were introduced to tablet PCs, either through workshops or more informally, they expressed interest and enthusiasm in this pen-based technology. Some professors independently adopted the tablets for uses outside of GIS-based field work, applying them to a range of field, lab, and classroom learning designs. They agreed that the tablets contributed positively to a variety of outcomes. A review of anecdotal and survey evidence suggests that the mobile devices were an effective tool for creating active learning experiences, as students were observed testing and refining mental models of spatial phenomena, and their completed work showed evidence of the integration of field work and lab analysis with prior knowledge delivered in class lectures and readings.
Technology Considerations for Using Tablet PCs in the Field
In the interest of full disclosure, our colleges each received Hewlett-Packard tablet PC grants, which provided each school with a completely outfitted mobile computing lab. Each course had available a laptop cart with about 10 to 20 tablet PCs. The grants made it possible for us to:
- Test and develop best practices for mobile computing in the field
- Determine suitability of tablet PCs to our curriculum (including introducing tablet PCs to new faculty users through workshops)
- Determine the costs of the technology (including hardware, software, and human)
- Make recommendations to others considering teaching with a mobile tablet PC device
The mobile computers we used initially were standard business-model tablet PCs. As is typical of tablet PCs, they did not come with an optical drive. To ease the routine of loading software, we used computer imaging or disk cloning software such as Ghost or Acronis to push the master tablet PC set of software out to all the other tablets. To run microprocessor-intensive software such as ArcGIS, we upgraded the RAM to at least 2 gigabytes.
Another notable aspect of a standard model tablet PC is that they are not designed for rugged outdoor field work. Field tablet devices need careful treatment, and students and professors must be mindful not to drop them. Also, wet weather can be a problem, although if the rain isn't too strong, a plastic bag will keep the tablet PC dry while still allowing for on-screen inking (see Figure 3). Despite these caveats for using non-rugged tablet PCs in the field, we had very few breakages and a surprisingly small number of hardware failures overall.
The mobile computer lab functions much like a standard desktop lab in that the tablet PCs need regular software and operating system patches and updates. Sometimes a pen needs replacement. A dedicated lab manager should be considered when thinking about investing in a suite of tablet PCs. If the tablet laptop cart is plugged in and the tablet PCs are charged and updated, professors and students can simply check out tablet computers when needed.
Though we started out with grant-funded tablet technology, some purchased additional tablet computers so that we could have more mobile devices on campus; others purchased new replacement tablet PCs after using them for four to five years. Those that replaced aging tablet PCs took into account constructive student and faculty comments on the technology. Most notably, drawbacks of the early tablet PC models included short battery life, poor screen visibility outdoors, need for increased processing power, and slowness in booting up. The newer tablet PCs, starting in around 2008, remedy some of those problems.
Typical Costs of Tablet PCs and Software
- Standard tablet PC, upgraded RAM, daylight viewable screen: $1,200 — $1,500
- GPS receiver attached at the USB port: ~$100
- External CD/DVD-R/RW drive: ~$100
- Ruggedized tablet PC with embedded GPS and other upgrades: ~$5,000
- ESRI's ArcGIS software, academic price: one seat = $250 (doesn't include extensions, which are $150/each) to campus-wide license = $5,000
- Photogrid: free
- Microsoft Office: academic campus-wide license cost varies by campus
Tablet PCs have come down in price but still remain more expensive than standard laptops or netbooks. A standard laptop, while having the mobility, light weight, and robustness of processing speed we seek for outdoor computing, does not have a pen or stylus, making it unsuitable for data collection. The costs of ruggedized tablet PCs for an entire class can be prohibitive, however. Unfortunately, other options for a mobile computing device suitable for the types of classes described in this article offer few viable alternatives. One of these, the Trimble Juno series of handheld GPS models, functions like a PC, can collect numeric and text values in addition to latitude and longitude coordinates, and has stylus-based touch screens for easy use in the field. In a 2009 article Steven Whitmeyer, Jeremy Nicoletti, and Declan De Paor discussed some of the data collection device alternatives they tried for geologic mapping.10 An iPhone, iTouch, Android, or PDA are not suitable for the outdoor classes we have described because of the small screen size and lack of applications to collect and store the kinds of data we collect in our classes. We tested an iPad with 3G capability to get reasonably reliable location-based information. The apps we used (Google Maps, Google Earth, and ArcGIS) worked well with the built-in wi-fi and 3G system, which relies on cellular service, for searching location, but because the iPad lacked a pen for annotation, we could not create new maps. In addition, the apps are not currently designed for data creation, although this could easily change in the near future.
As the tablet PC industry matures, we hope to see a mobile device that is more robust in a field-based setting, one featuring weather resistance and able to handle a few knocks. Most tablets produced now are built for the business market. A longer battery life or hot-swappable battery capability would help extend our time in the field. Making a lighter tablet PC while still maintaining the screen size (approximately 9 to 12 inches) would be critical for field work. Ideally, for our purposes we would also like to see embedded GPS receivers in a new tablet PC.
Concluding Thoughts
Our colleges had the luxury of (1) small class sizes, (2) a large number of mobile tablet PCs, and (3) support technologists to work through inevitable difficulties in the field. Overall, the tablet PCs worked well for our purposes, acting as a data collection device so that students could record their observations and analyses while still in the field. Using this mobile computing method, there was no need to download and post-process waypoints, hand-written notes, or sketches because these data were already documented in a fully functioning computer. We think that a tablet PC taken outside the walls of a classroom can work for all sorts of courses that take students into the field. Surveys in sociology, block-by-block observations in political science, businesses and land uses surrounding elementary schools for an education class, for example, can all be done using standard software on a pen-enabled tablet PC.
Taking into consideration the student evaluations of each of these courses, all taught differently and each with different evaluation criteria, overall we found general agreement among students that the use of tablet PCs in these active-learning, outdoor science classes was a positive experience and useful to the research exercise. Anecdotally, qualitatively, and through faculty observation, the students found the use of technologies in the field-based classroom — from mobile tablet PCs to scientific visualization software — also helped them see geographic context and patterns and hone their understanding of the scientific method. Negative comments typically revolved around hardware failures, such as short battery life and slow computer speed, but also noted difficulties with the specialized software, especially ArcGIS.
A tablet PC in the hands of an inexperienced student has its challenges. A paper notebook and a pencil are familiar tools to students and so are easier to work with than using the tablet's pen-based technology. Before integrating tablet PCs into their teaching, faculty members will want to ask themselves what their goals are:
- Do they want students to collect data efficiently and somewhat quickly?
- Do they want to reduce transcription errors?
- Do they want their students to experience an emerging technology?
- Do they want to put more digital information into students' hands while they're learning?
Whatever faculty decide as they pull on their boots and set off to use the outdoors to teach in, the learning goals for the course should set the agenda — not the use a specific technology.
Additional Resources
Science Education Resource Center at Carleton College, Teaching With GeoPads
Menking, Kirsten, and Meg E. Stewart, "Using Mobile Mapping to Determine Rates of Meander Migration in an Undergraduate Geomorphology Course," Journal of Geoscience Education, vol. 55, no. 2 (2007), pp. 147–151.
Purdue University, Information Technology at Purdue, Faculty Showcase: Teaching Soil-Landscape Interactions by Bringing Geographic Information Systems (GIS) Technology to Students in the Field by Darrell G. Schulze
Acknowledgments
We gratefully acknowledge the Hewlett-Packard Technology for Teaching Grant Initiative and Jim Vanides, education program manager at HP. Jason Long and Keely Roen of Pennsylvania State University kindly shared their survey instrument (with Meg Stewart). Thank you to Dave Tewksbury, Kathy Eiseman, Susan Knauss, Steven Citron-Pousty, and Jay Henderson for responding to a list-serve query regarding iPads and mapping.
- Cheryl B. Torsney, "The Value of an Outdoor Education Experience," Reality Check column, Peer Review (Winter 2008), p. 27.
- Larry Johnson, Rachel Smith, Holly Willis, Alan Levine, and Keene Haywood, "The Horizon Report: 2011 Edition ," The New Media Consortium (2011), pp. 12–15.
- Marc P. Armstrong and David A. Bennett, "A Manifesto on Mobile Computing in Geographic Education," The Professional Geographer, vol. 57, no. 4 (November 2005), p. 506–515.
- Keith C. Clarke, "Mobile Mapping and Geographic Information Systems," Cartography and Geographic Information Science, vol. 31 (2004), p. 131–136.
- Anne H. Moore, Shelli B. Fowler, and C. Edward Watson, "Active Learning and Technology: Designing Change for Faculty, Students, and Institutions," EDUCAUSE Review, vol. 42, no. 5 (September/October 2007), pp. 42–61.
- Meg Stewart, "Notes & Ideas: Paperless, Wireless, Inkless Mapping," Academic Commons, September 25, 2006.
- Josh Fischman quoting Walt Mossberg, "Expert Predicts a Deluge of Tablet Computers on Campuses," Chronicle of Higher Education, January 7, 2011.
- Shannon D. Smith and Judith Borreson Caruso, with an introduction by Joshua Kim, The ECAR Study of Undergraduate Students and Information Technology, 2010 (ECAR Research Study, vol. 6, 2010), (Boulder, CO: EDUCAUSE, 2010), p. 91, Figure 6-14.
- Richard Mayer, "Designing Instruction for Constructivist Learning," in Instructional-Design Theories and Models: A New Paradigm of Instructional Theory, Vol. 3, Charles M. Reigeluth, ed. (Hillsdale, NJ: Lawrence Erlbaum Associates, 1999).
- Steven J. Whitmeyer, Jeremy Nicoletti, and Declan G. De Paor, "The Digital Revolution in Geologic Mapping," GSA Today, vol. 20, no. 4 (April/May 2010), pp. 4–10.
© 2011 Meg Stewart, Jeffrey Clark, Jeremy Donald, and Keri VanCamp. The text of this EQ article is licensed under the Creative Commons Attribution-Noncommercial-Share Alike 3.0 license.