Overview
The community college students in our sample are similar to their peers at other degree-granting institutions in a few demographic categories. The gender distribution at community colleges is nearly the same,1 with 33% of respondents identifying as male, 67% identifying as female, and 29% of students at both community colleges and four-year institutions reporting they were first-generation college students. The ethnic distribution in community colleges for Asian and black students (both at 7%) and those identifying as another ethnicity (9%) is also similar to that of other institutions;2 more community college students identified as white (70% compared with 56%), and fewer students identified as Hispanic (8% compared with 19%). However, it is important to note that our sample of community college students is not representative. National statistics tell us that more Hispanic (25%) and black (13%) students and fewer white students (46%) attend two-year and AA degree-granting colleges.3 In our study, community colleges in the upper Midwest region have greater representation than those in other areas of the United States4 that are more ethnically diverse.
Our findings indicate that community college students are older and have more responsibilities than their four-year institution peers, as we saw statistically significant differences when we examined their work and household situations. Three quarters (78%) of our sample of all students are between the ages of 18 and 24 (82% among non–community college and 58% among community college respondents), but community college attendees are older than four-year students by about four years, with a mean age of 27.5 Our data also suggest that community college students are more likely to be economically disadvantaged, with 66% reporting they were eligible for Pell grants, compared with 57% for students who attend other schools. Sixty-one percent of community college students are enrolled full time,6 a significantly smaller percentage than for undergraduates at schools in the other Carnegie classes (87%).
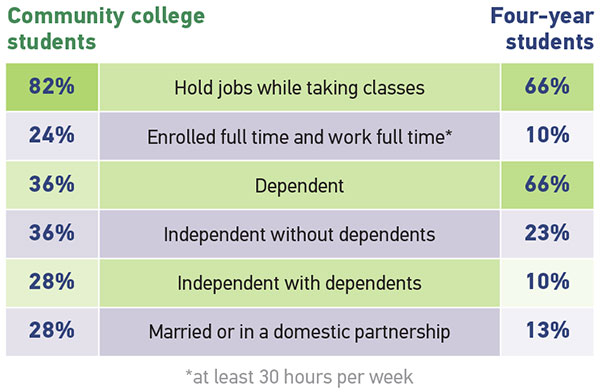
More community college respondents told us that they are employed and that they work more hours than their counterparts, with 82% reporting they held jobs (including hourly work-study) while taking classes, compared with 66% of four-year students. A majority (55%) of both student groups who are enrolled full time reported that they work part time (fewer than 30 hours per week); however, two-year and AA students are more likely to have full-time jobs. Among those students enrolled full time at two-year schools, 24% are employed full time (30 or more hours per week), which is a significantly greater percentage than that of their peers at other institutions (see figure 2). The largest share (64%) of community college respondents are independent (with and without dependents), compared with their four-year peers; nearly three times as many are independent with dependents of their own (28%); and twice as many are married or in a domestic partnership (28%) as their four-year peers. Within community colleges, more females (32%) than males (22%) reported being independent with dependents. Females with dependents at community colleges are likely single mothers, as data from the Institute for Women's Policy Research show that a plurality of single mothers (44%) are enrolled in public two-year institutions.7
Notes
-
Among respondents at non–community colleges, 34% are male and 66% are female.
↩︎ -
At four-year colleges and universities, 10% of respondents are Asian/Pacific Islander, 6% are Black/African American, and 10% identified as Other or multiple ethnicities.
↩︎ -
American Association of Community Colleges, "Fast Facts 2019."
↩︎ -
Sixty-seven percent of community college participants came from institutions in the Plains States (Iowa, Kansas, Minnesota, Missouri, Nebraska, North Dakota, and South Dakota). Other US regions represented included the Great Lakes at 12%, Mid-East at 10%, Southeast at 5%, Far West at 3%, and the Southwest at 3%. There was no participation from community colleges in the New England or Rocky Mountain states or in outlying areas/US territories.
↩︎ -
The mean age from our sample is slightly younger than the mean age reported by the American Association of Community Colleges, which is 28 years. See AACC's "Fast Facts 2018."
↩︎ -
Our data differ from analysis of NCES data done by the American Association of Community Colleges, which indicates that 63% of community college students are enrolled part time and 37% are enrolled full time. See AACC's "Fast Facts 2019."
↩︎ -
Institute for Women's Policy Research, "Single Mothers in College: Growing Enrollment, Financial Challenges, and the Benefits of Attainment," briefing paper, September 2017.
↩︎