Device Access and Ownership
EDUCAUSE has tracked student ownership of digital technologies that might be used for academic work for nearly a decade. We have observed how the rapid rise of laptop and smartphone ownership has increased to near-universal levels, squeezing out cumbersome desktops and redundant tablets to become the most popular combination of digital devices used by students.1 While device ownership tells us a lot about the devices students have at their fingertips, it introduces socioeconomic bias into the measure in favor of those with higher incomes. This year, we improved our inquiry process to align more closely with the principle of equitable access outlined in UNESCO's Qingdao Declaration and EDUCAUSE's commitment to diversity, equity, and inclusion (DEI) by first asking if students had access to an array of technologies before turning to questions of how they have access to those technologies.
The percentages of students who have access to digital technologies vary considerably, with the workhorse technologies of smartphones (95%) and laptops (91%) topping the list and the newer, more expensive technologies of AR and VR headsets (4%) and 3D printers (3%) rounding out the bottom (see figure 1). And when it comes to access, practically every student has access to at least one of the technologies students identify as among the most important for their academic success (see "Device Use and Importance"). Only 65 participants (fewer than 1%) reported having no access to any of the four digital devices that their peers deem most critical to student success: laptops, desktops, hybrids,2 or smartphones. In this way, US students now appear to have overcome the problem of digital inclusion3 that relates to access to internet-enabled devices and reliable Wi-Fi. An analysis of the typical correlates of the digital divide—ethnicity, gender, age, and socioeconomic status—fails to reveal a pattern of unequal access to the devices most important to student academic success.
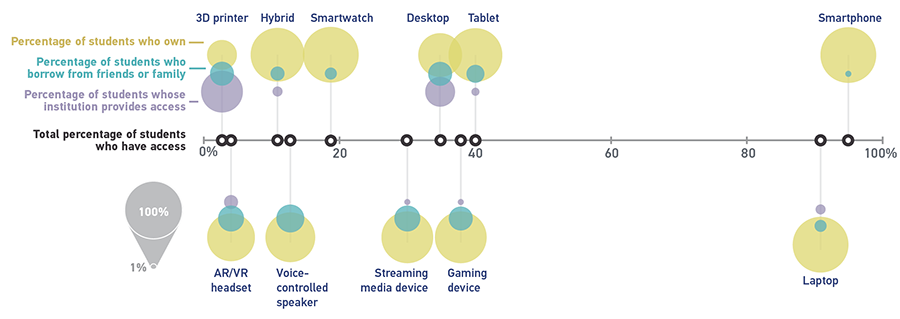
How students access technology varies by a combination of device type and purpose. The first group of devices consists of smartphones, laptops, and hybrids, which are important contributors to student productivity and are owned at the highest rates. With the exception of the smartwatch, the second group includes personal devices that are designed for consumption and/or entertainment purposes and are mostly owned (tablets, gaming devices, streaming media devices, and voice-controlled speakers) but are also frequently borrowed from family and friends. The last group of devices (AR/VR headsets and 3D printers) is characterized mainly by a heavier student reliance on the provision of technologies by their institutions because presently they may be too bulky or expensive for individual ownership. A majority of students who have access to desktops own them; however, more than a quarter of students have access to desktops via their institutions, likely through computer labs. Similarly, bleeding-edge technologies such as AR/VR headsets and 3D printers are also made available by colleges and universities at higher rates than personal devices used for productive or consumptive activities. While Google Cardboard and other inexpensive stereoscopic AR/VR headset alternatives may increase ownership of these technologies, the vast majority of students (96%) do not have access to these devices.
One clear factor behind the disparities in students' access to campus-owned extended reality (XR)4 technologies is a student's major. STEM-related majors such as computer science, engineering, architecture, and (to a lesser degree) manufacturing, construction, repair, or transportation tend to allow more access to the institution's 3D printers than other majors, as would be expected. Relatedly, the familiar patterns of age- and gender-based inequalities in terms of AR/VR headset ownership are also manifest here: Younger female students are significantly less likely to own these devices than older male students. When it comes to 3D printers, older students are more than two times as likely to own these new and expensive devices than younger students. The intersection of the prevalence of XR technologies in fields that tend to be dominated by men is not surprising, but the solution to increasing access is not necessarily opening XR labs to all so much as it is opening STEM majors to more women and thinking about how non-STEM fields can leverage these emerging technologies to their pedagogical advantage.
EDUCAUSE predicts that the adoption of XR technologies in teaching, learning, and research will only increase in the next few years as they become more affordable, user friendly, and portable. In our recent report on 3D technologies, Learning in Three Dimensions: Report on the EDUCAUSE/HP Campus of the Future Project, we recommended increasing student access to these expensive, cutting-edge technologies by housing them in public spaces (e.g., a makerspace, a library, a dedicated media space). Offering student orientation and training programs and marketing these to diverse populations on campus are also key to increasing student access to this emerging tech. Gender disparities are especially problematic in makerspaces where women are underrepresented.5 Research has shown gender bias in the ways these spaces are staffed, managed, and marketed,6 which is an extension of the lack of female representation that has been examined in STEM fields.7 Increasing student access to 3D technologies in these ways encourages student experimentation, provokes innovative interdisciplinary applications of these technologies,8 and may support larger institutional XR goals and initiatives. Limited or no access to these expensive, emerging technologies, especially based on student major, may exacerbate existing or produce new patterns of digital exclusion among students at US institutions. And, given the near-universal access to the digital devices that students find most important for doing their work, it would be irresponsible to replace one digital divide with another by systematically limiting access. Indeed, we should not just avoid sustaining or replicating inequities—we should be intentionally providing equitable opportunities for all students.
Notes
-
D. Christopher Brooks and Jeffrey Pomerantz, ECAR Study of Undergraduate Students and Information Technology, 2017, research report (Louisville, CO: ECAR, October 2017), 12–14.
↩︎ -
For this project we defined hybrids as 2-in-1 devices that function as laptops with touchscreen capabilities (e.g., Lenovo Yoga, Microsoft Surface). In this way, a hybrid device replaces the need for laptops and tablets by the 11% of students who have access to them.
↩︎ -
"Digital inclusion" is defined by the National Digital Inclusion Alliance as including five elements: "1) affordable, robust broadband internet service; 2) internet-enabled devices that meet the needs of the user; 3) access to digital literacy training; 4) quality technical support; and 5) applications and online content designed to enable and encourage self-sufficiency, participation and collaboration."
↩︎ -
EDUCAUSE defines "extended reality" (XR) as a wide range of technologies along a continuum, with the real world at one end and fully immersive (e.g., virtual reality) simulations at the other, with gradations of mixed environments (e.g., augmented reality) in between. See Jeffrey Pomerantz, Learning in Three Dimensions: Report on the EDUCAUSE/HP Campus of the Future Project, research report (Louisville, CO: EDUCAUSE, August 2018), 3.
↩︎ -
Stephen Noonoo, "Maker Culture Has a 'Deeply Unsettling' Gender Problem," EdSurge, June 14, 2018; "MakeHers Report: Engaging Girls and Women in Technology through Making, Creating, and Inventing," Intel, 2014.
↩︎ -
Youngmoo E. Kim, Kareem Edouard, Katelyn Alderfer, and Brian K. Smith, Making Culture: A National Study of Education Makerspaces, Drexel University, 2018.
↩︎ -
Noonoo, "Maker Culture Has a 'Deeply Unsettling' Gender Problem," 2018; Ryan Noonan, "Women in STEM: 2017 Update," U.S. Department of Commerce Economics and Statistics Administration, Office of the Chief Economist, November 13, 2017.
↩︎ -
Dana Gierdowski and Daniel Reis, "The Mobile Maker: An Experiment with a Mobile Makerspace," Library Hi Tech 33, no. 4 (2015): 480–96, DOI: 10.1108/LHT-06-2015-0067; David. M. Sheridan, "Fabricating Consent: Three-Dimensional Objects as Rhetorical Compositions." Computers and Composition 27, no. 4 (2010): 249–65, DOI: 10.1016/j.compcom.2010.09.005.
↩︎