Analytics
While many technologies may develop at breakneck speeds, provoking revolutionary change in their respective higher education domains, the strategic importance of analytics in higher education may be proving to be more evolutionary in nature. From the moment EDUCAUSE first published on the topic in 2005, the promise of what analytics could do seems to have always outpaced our ability to realize its potential in practical and meaningful ways. After debuting on the Gartner Hype Cycle as an emerging technology in 2010, analytics (in various forms) languished in the 2–5 year zone. Indeed, the level of analytics maturity in higher education as measured by EDUCAUSE remained underdeveloped and largely stagnant between 2012 and 2014, a condition produced in part by low levels of institutional investments and resources being committed to analytics projects.
This section covers the 13 trends and 13 technologies included in the analytics domain. The placement and appearance of analytics in the EDUCAUSE Top 10 IT Issues has been sporadic over the past several years. This year, however, the influence, strategic availability, and importance of technologies in this domain are reaching a critical mass with the #4 rank in the Top 10 IT Issues (in the form of "Data-enabled Institutional Culture") and the #8 rank in the Top 10 Strategic Technologies (as "Predictive analytics for student success [institutional level]").
Trends
Included in this domain:
- Applications and implications of artificial intelligence to higher education
- Blending of roles and blurring of boundaries between IT and academic/administrative areas
- Business process redesign
- Changing enterprise system architectures, integrations, and workflows
- Contributions of IT to institutional operational excellence
- Data-driven decision making
- Increasing complexity of technology, architecture, and data
- Institution-wide data management and integrations
- Internet of Things
- Strategic relationships with vendors
- Student success focus/imperatives
- Ubiquitous digital sources and streams
- Use of algorithms to influence institutional and individual choices
Understand how the most influential trends are affecting your institution.
Four trends are influential at 61% or more of colleges and universities:
- Student success focus/imperatives
- Data-driven decision making
- Contributions of IT to institutional operational excellence
- Increasing complexity of technology, architecture, and data
Review the trends that are taking hold and address them at your institution.
Four trends are influential at 41–60% of institutions (listed below from highest to lowest level of influence):
- Institution-wide data management and integrations
- Business process redesign
- Changing enterprise system architectures, integrations, and workflows
- Strategic relationships with vendors
Understand these trends, and consider their possible role at your institution.
The influence of two trends is limited to 21–40% of institutions. Higher education is monitoring these trends with respect to emerging IT strategy and the deployment of analytics strategic technologies (listed below from highest to lowest level of influence):
- Blending of roles and blurring of boundaries between IT and academic/administrative areas
- Ubiquitous digital sources and streams
The remaining three trends were of limited impact in our research:
- Internet of Things
- Use of algorithms to influence institutional and individual choices
- Applications and implications of artificial intelligence to higher education
Technologies
Included in this domain:
- Flexible interactive platforms for descriptive and predictive analytics of institutional data
- High-precision location-sensing technologies
- Integration platform as a service
- Location-based computing
- Massively scalable database architectures and software
- Mobile apps for institutional BI/analytics
- Predictive analytics for institutional performance
- Predictive analytics for student success (institutional level)
- Predictive learning analytics (course level)
- Talent/workforce analytics
- Technologies for improving analysis of student data
- Text/content analytics
- Uses of the Internet of Things for campus management
Complete initial deployment and maintain these technologies.
Our research shows that most institutions are not ready to deploy these analytics strategic technologies. Consider initial deployment only if one of these technologies is essential to your analytics strategy.
Pilot and start deploying these technologies.
At this time, a majority of institutions are planning to pilot and deploy these two analytics strategic technologies (listed below from highest to lowest attention):
- Technologies for improving analysis of student data
- Predictive analytics for student success (institutional level)
Decide when these technologies fit your strategy, and start planning.
A majority of institutions are watching these two analytics strategic technologies carefully, deciding and planning for potential future deployment (listed below from highest to lowest attention):
- Predictive analytics for institutional performance
- Flexible interactive platforms for descriptive and predictive analytics of institutional data
Learn about and track these technologies.
A majority of institutions are tracking and learning about the following nine analytics strategic technologies (listed below from highest to lowest attention):
- Predictive learning analytics (course level)
- Integration platform as a service
- Mobile apps for institutional BI/analytics
- Talent/workforce analytics
- Uses of the Internet of Things for campus management
- High-precision location-sensing technologies
- Text/content analytics
- Massively scalable database architectures and software
- Location-based computing
Peer Institution Approach to Strategic Technologies
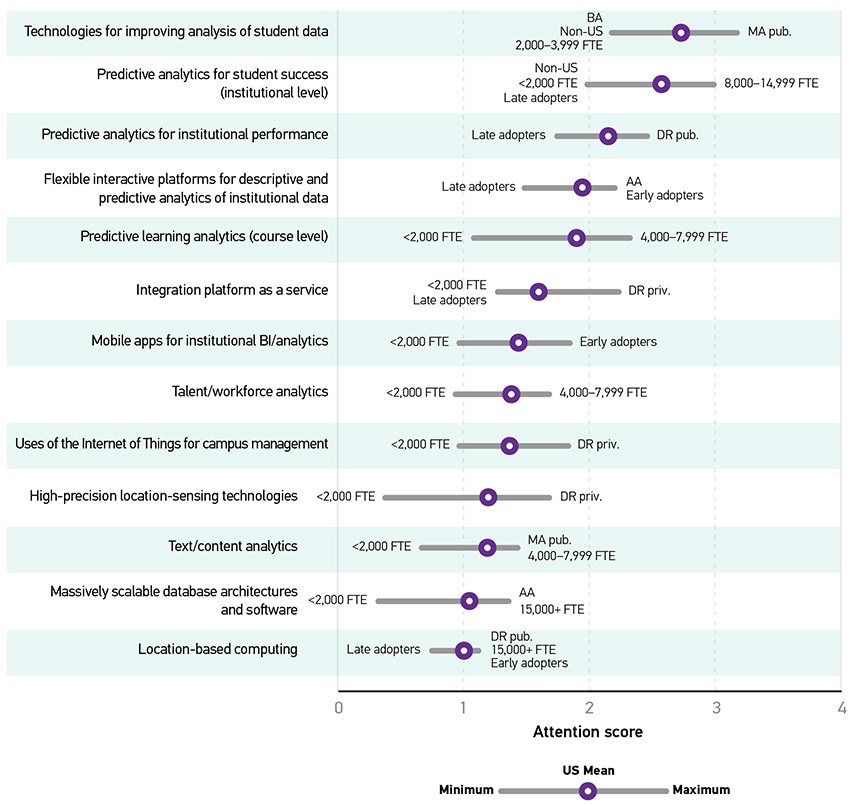
Understanding what peer institutions (both current and aspirational) are doing can help you gauge whether your institution's current approach is on track or might warrant reconsideration. Some technologies are more relevant for some types of institutions than others. We looked at broad demographic categories, including Carnegie class, institutional size, and approach to technology adoption and found differences in attention score based on those factors. (See the methodology section for explanation of our attention score calculation.) In figure 1, the US mean is the average attention score for an item from all US respondents. The minimums and maximums are the lowest and highest average attention scores among all groups within the categories of Carnegie class, institution size, and timing of technology adoption, with labels indicating which group or groups returned that score. In the event of a tie, all tied groups are represented.
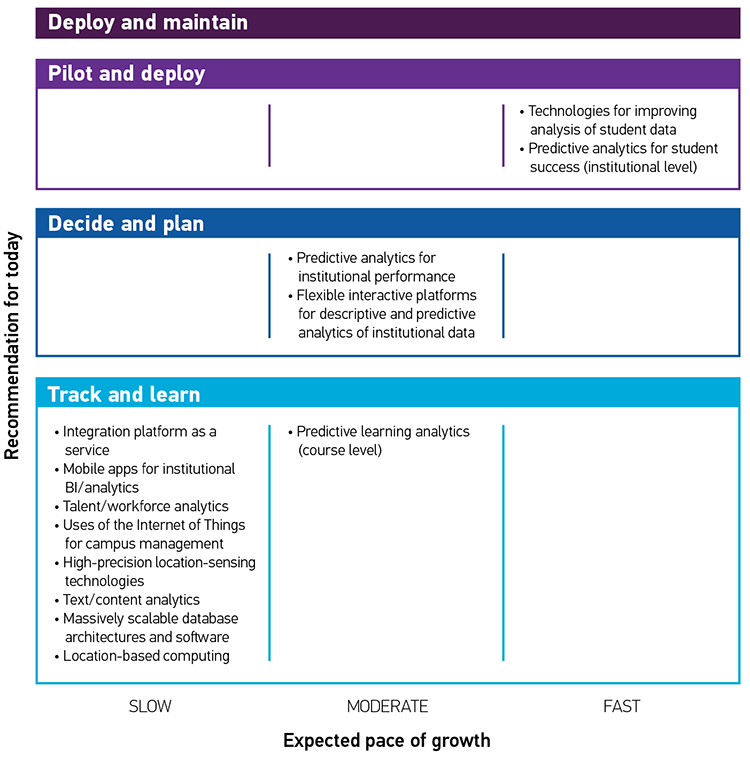
Preparing for the Future
Understanding the technologies that are most relevant for your institution and how fast a certain strategic technology may be growing is critical to institutional IT strategy. We estimated the pace of growth based on the percentage of institutions we predict will implement each technology over the next five years (by 2023). Figure 2 positions each technology in one of 12 cells based on institutional intentions (the "recommendation for today") and the expected pace of growth of that technology. Reflecting what was noted above, the figure shows that analytics technologies related to student data and success are on the fast track for growth.