Teaching and Learning
Arguably the most important mission of higher education, the teaching and learning domain has the largest combination of trends (16) and technologies (25) of any of the domains covered in this report. This complexity of the teaching and learning domain is well known to educational technologists and often stands as one of the greatest obstacles to securing the buy-in of the end users with whom the responsibility of teaching and learning resides—faculty. Faculty are often depicted as resistant to the use of educational technologies in service to teaching and learning. ECAR has found, however, that faculty on average have fairly positive views about technology and are very much open to the possibility that technologies may make them more effective instructors, provided that there is a clear indication or evidence that students would benefit from incorporating a given technology, and provided that faculty have release time to design and/or redesign their courses. Additionally, faculty (along with students) are buying into the student success movement, viewing student success technologies that support retention, learning, and completion as important tools.
This section covers the 16 trends and 25 technologies included in the teaching and learning domain. The most influential trend on teaching and learning is the focus and imperative of student success. Of the 25 technologies occupying the domain of teaching and learning, 7 of them appear in the Top 10 Strategic Technologies for 2018: uses of APIs (#1); active learning classrooms (#2); incorporation of mobile devices in teaching and learning (#3); technologies for improving analysis of student data (#5); technologies for planning and mapping student educational plans (#6); predictive analytics for student success (institutional level) (#8); and student success planning systems (#10). Given the mounting evidence of the impact of digital and analog teaching and learning environments, students' preferences for blended learning environments, and faculty and student perceptions of the utility of student success technologies, teaching and learning with technology is once again poised to shape higher education.
Trends
Included in this domain:
- Adaptive learning
- Blending of roles and blurring of boundaries between IT and academic/administrative areas
- Changing enterprise system architectures, integrations, and workflows
- Changing faculty roles
- Cross-institutional partnerships and consortia
- Digital enterprise strategy
- Digitization of scholarly and research data
- Diversity, equity, and inclusion
- Evaluation of technology-based instructional innovations
- Internet of Things
- IT as an agent of institutional transformation and innovation
- Strategic relationships with vendors
- Student success focus/imperatives
- Ubiquitous digital sources and streams
- User-centered design
- Vendor relationships that bypass IT
Understand how the most influential trends are affecting your institution.
One trend is influential at 61% or more of colleges and universities:
- Student success focus/imperatives
Review the trends that are taking hold and address them at your institution.
Four trends are influential at 41–60% of institutions (listed below from highest to lowest level of influence):
- IT as an agent of institutional transformation and innovation
- Changing enterprise system architectures, integrations, and workflows
- Strategic relationships with vendors
- Diversity, equity, and inclusion
Understand these trends, and consider their possible role at your institution.
The influence of eight trends is limited to 21–40% of institutions. Higher education is monitoring these trends with respect to emerging IT strategy and the deployment of teaching and learning strategic technologies (listed below from highest to lowest level of influence):
- Blending of roles and blurring of boundaries between IT and academic/administrative areas
- Cross-institutional partnerships and consortia
- Evaluation of technology-based instructional innovations
- User-centered design
- Digital enterprise strategy
- Vendor relationships that bypass IT
- Digitization of scholarly and research data
- Ubiquitous digital sources and streams
The remaining three trends were of limited impact in our research:
- Adaptive learning
- Changing faculty roles
- Internet of Things
Technologies
Included in this domain:
- Active learning classrooms
- Adaptive learning
- Augmented and virtual reality for teaching and learning
- Blockchain
- Courseware
- Digital microcredentials (including badging)
- Games and gamification
- Incorporation of mobile devices in teaching and learning
- Institutional support for speech recognition
- Integration/uses of voice-user interfaces
- IT accessibility assessment tools
- Mobile app development
- Next-generation LMS/digital learning environment
- Open educational resources
- Predictive analytics for student success (institutional level)
- Predictive learning analytics (course level)
- Remote proctoring services
- Student success planning systems
- Support for use of personal cloud services
- Technologies for improving analysis of student data
- Technologies for offering self-service resources that reduce advisor workloads
- Technologies for planning and mapping student educational plans
- Text/content analytics
- Uses of APIs
- Uses of the Internet of Things for teaching and learning
Complete initial deployment and maintain these technologies.
Our research shows that most institutions are not ready to deploy these teaching and learning strategic technologies. Consider initial deployment only if one of these technologies is essential to your teaching and learning strategy.
Pilot and start deploying these technologies.
At this time, about one-half to two-thirds of institutions are planning to pilot and deploy these nine teaching and learning strategic technologies (listed below from highest to lowest attention):
- Uses of APIs
- Active learning classrooms
- Incorporation of mobile devices in teaching and learning
- Technologies for improving analysis of student data
- Technologies for planning and mapping student educational plans
- Predictive analytics for student success (institutional level)
- Student success planning systems
- Technologies for offering self-service resources that reduce advisor workloads
- Mobile app development
Decide when these technologies fit your strategy, and start planning.
About half of institutions are watching these seven teaching and learning strategic technologies carefully, deciding and planning for potential future deployment (listed below from highest to lowest attention):
- IT accessibility assessment tools
- Open educational resources
- Next-generation LMS/digital learning environment
- Courseware
- Adaptive learning
- Augmented and virtual reality for teaching and learning
- Games and gamification
Learn about and track these technologies.
A majority of institutions are tracking and learning about the following nine teaching and learning strategic technologies (listed below from highest to lowest attention):
- Predictive learning analytics (course level)
- Remote proctoring services
- Digital microcredentials (including badging)
- Uses of the Internet of Things for teaching and learning
- Support for use of personal cloud services
- Text/content analytics
- Institutional support for speech recognition
- Integration/uses of voice-user interfaces
- Blockchain
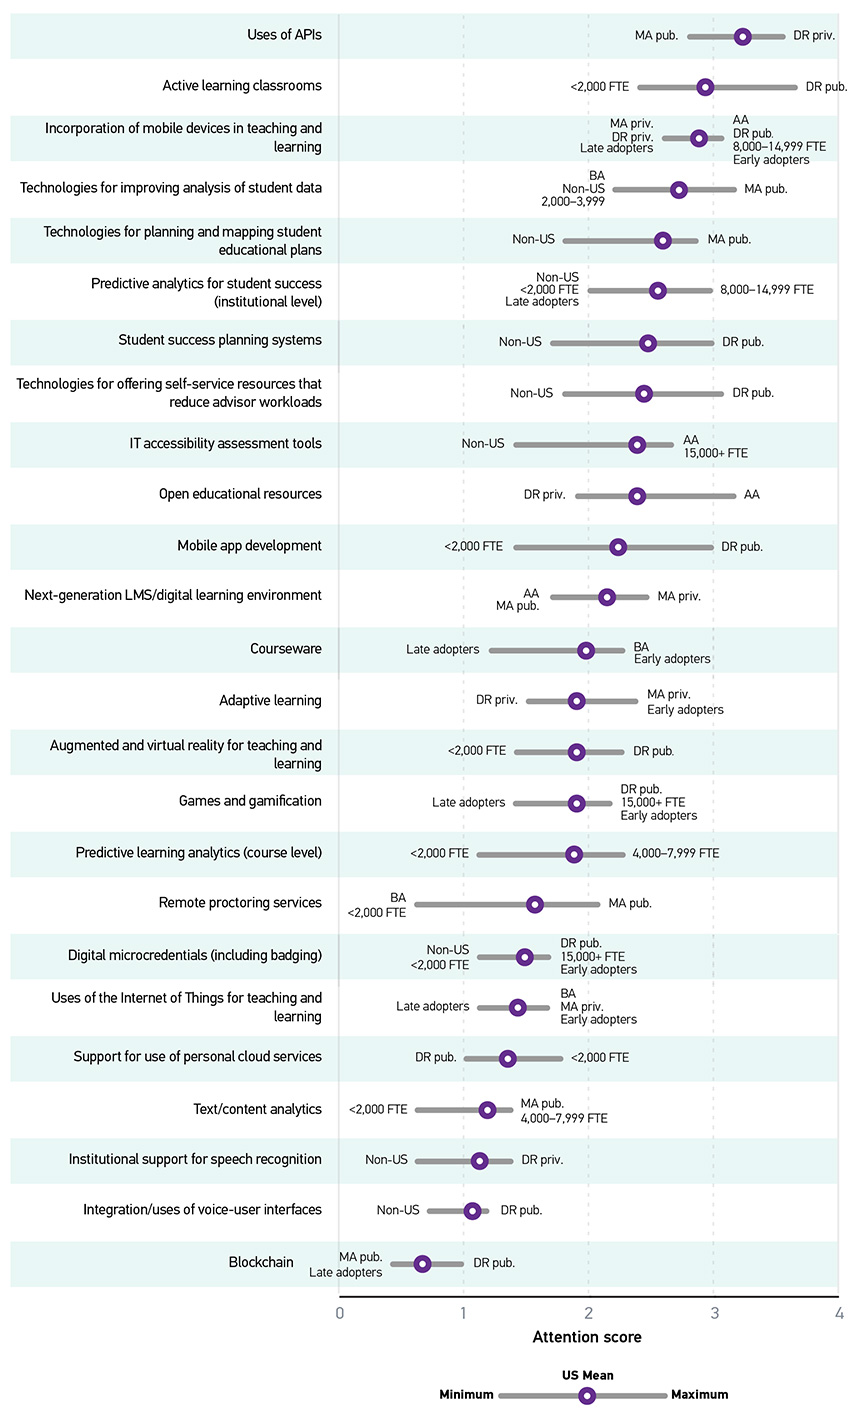
Peer Institution Approach to Strategic Technologies
Understanding what peer institutions (both current and aspirational) are doing can help you gauge whether your institution's current approach is on track or might warrant reconsideration. Some technologies are more relevant for some types of institutions than others. We looked at broad demographic categories, including Carnegie class, institutional size, and approach to technology adoption and found differences in attention score based on those factors. (See the methodology section for explanation of our attention score calculation.) In figure 15, the US mean is the average attention score for an item from all US respondents. The minimums and maximums are the lowest and highest average attention scores among all groups within the categories of Carnegie class, institution size, and timing of technology adoption, with labels indicating which group or groups returned that score. In the event of a tie, all tied groups are represented.
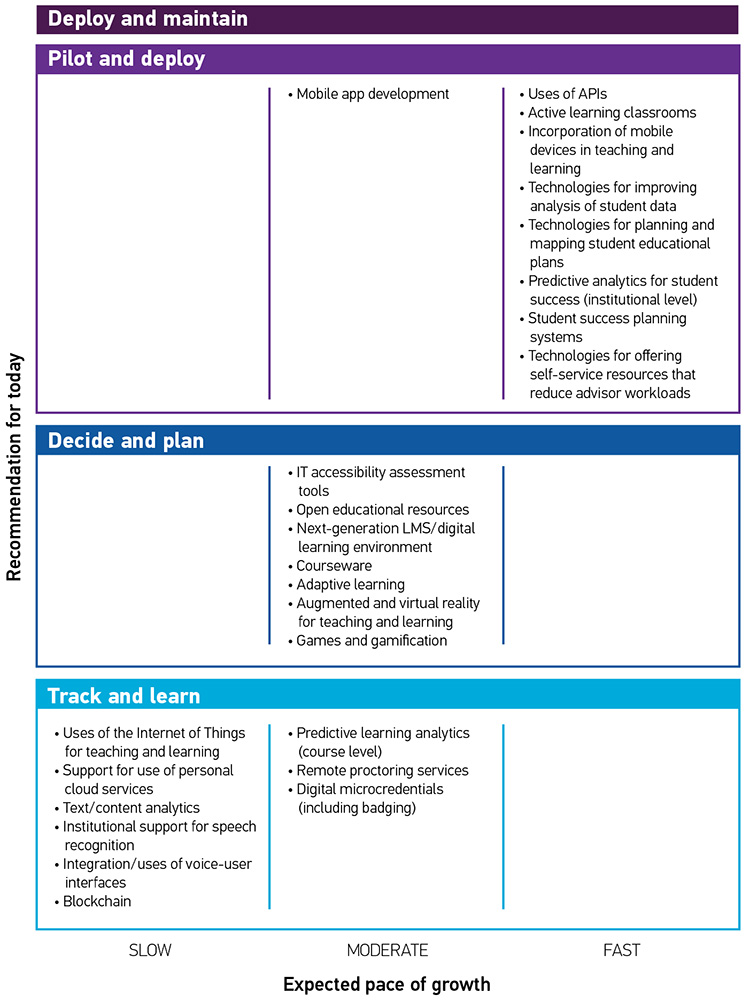
Preparing for the Future
Understanding the technologies that are most relevant for your institution and how fast a certain strategic technology may be growing is critical to institutional IT strategy. We estimated the pace of growth based on the percentage of institutions we predict will implement each technology over the next five years (by 2023). Figure 16 positions each technology in one of 12 cells based on institutional intentions (the "recommendation for today") and the expected pace of growth of that technology. Reflecting what was noted above, the figure shows that many of the technologies we tracked are reaching the deployment stage at most institutions.