
Key Takeaways
- Organizations that achieve higher maturity in IT project portfolio management consistently show both increased performance and tighter alignment between IT and business goals.
- A new tool can help higher education institutions move toward greater maturity levels by helping them select and prioritize projects.
- The tool gives institutions a framework for scoring a project's expected effort and impact, setting the stage for informed discussions among stakeholders and governing bodies.
Andy Miller is senior director of Enterprise Applications and Data Services, California State University, Chico.
Project management can be broadly considered an interconnected series of hierarchical elements (see figure 1). These elements include
- a project portfolio, which consists of a group of programs and/or individual projects positioned in some meaningful way to meet overall business objectives1;
- a project program, which is a related group of individual projects; and
- individual projects.
Project portfolio management (PPM) focuses on managing the entire project portfolio.
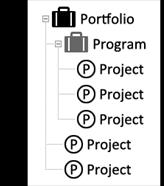
Figure 1. Project management as
a series of hierarchical elements
Research literature consistently indicates that higher levels of IT PPM maturity are correlated with higher-performing organizations that enjoy tighter alignment between IT and the business of the institution. This is a recurring theme in many research streams, including IT PPM,2 IT portfolio management,3 IT governance,4 and IT-business alignment.5
Colleges and universities hoping to move their PPM processes to more mature models have access to a wealth of research and information. Getting started, however, can seem daunting because of the breadth of components comprising PPM and the prerequisites for success. Here, I target a focused aspect of PPM — project selection and prioritization — and present a model for public nonprofit higher education colleges and universities to get started. At a high level, this model includes a tool for scoring and comparing individual projects, and it discusses considerations for a governance framework.
Project Portfolio Management
Whereas project management is concerned with "doing projects right," PPM is concerned with "doing the right projects." Elements and objectives of mature PPM include
- defining the portfolio's overall goals and objectives;
- assessing the finances, risks, and project interdependencies;
- managing resources;
- selecting and prioritizing projects;
- maintaining a centralized view of projects; and
- optimizing the portfolio.6
PPM is often performed from a centrally managed project management office. When organizations lack formal PPM processes, many problems can arise:
- A proliferation of projects that are either outside the strategic objectives or that fail to add significant measurable value
- Groups of projects that are unbalanced or uncoordinated
- Conflicting or redundant objectives
- Resource constraints and conflicts
- A lack of executive support or commitment
Conversely, mature PPM processes can result in maximization of IT investments, minimization of risk, improved alignment between the business and IT at both strategic and tactical levels, and efficient resource allocation.7
An organization's PPM processes can exist within a spectrum of maturity. At the most immature, PPM might simply include centrally tracking the organization's projects, with not much "portfolio management" actually occurring. Organizations in this spectrum might execute projects with little assessment or measurement, prioritizing them on the basis of first-come, first-served — or, perhaps more commonly, based on the power or audibility of the project requestor.8
Moving toward greater maturity levels, tactical PPM is concerned with selecting the "best projects" and managing resource allocations and conflicts between them. In this spectrum, organizations might consider the portfolio more holistically, but tend to do so tactically rather than strategically.
At the greatest maturity levels, strategic PPM is concerned not just with selecting the best projects, but rather with selecting and consistently rebalancing the best set of projects that will meet the organization's strategic goals.9 Figure 2 shows this spectrum of PPM maturity.
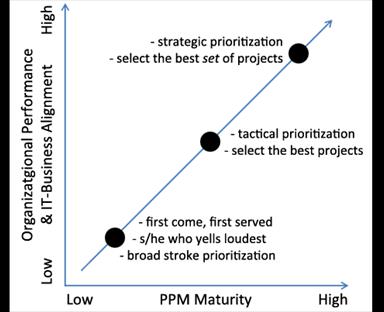
Figure 2. Organizational performance vs. PPM maturity
Project Prioritization
Often, organizations using immature PPM processes prioritize their projects in large aggregate groups, categorizing them solely in terms of low, medium, or high priority. This might work for a portfolio with few projects, but as the portfolio begins to grow, it can create significant problems, particularly in terms of resource allocation. Project management and resource allocation become very difficult for managers (or support teams) faced with several concurrent "high priority" projects. Which projects should really receive focused attention? Which ones should really receive the highest priority?
To implement more mature and finely grained project prioritization, organizations must meet several prerequisites. In some regards, these prerequisites are the same as those required to implement more mature portfolio management; at a high level they include
- an organizational strategy,
- executive leaders' involvement and buy-in (both within IT and across functional business units), and
- team skills.10
The maturation process can take several years. During this time, the successful organization must demonstrate a willingness to act with intent, address current and future governance mechanisms, implement PPM incrementally, and understand how best to balance competing forces and business needs.11
As a practical matter, project prioritization is often concerned more with resource allocation and conflict resolution than with the order in which projects are started or completed. This is because different projects can require non-conflicting resources. As a simple example, consider two hypothetical projects: the first is an upgrade from MS Exchange Server 2007 to 2013; the second is a new student enrollment channel in the university portal.
The first project is estimated to take 600 hours and is the organization's top priority; the second project is estimated to take 200 hours and is the second priority. The first project requires resources solely from the infrastructure team, while the second project requires resources solely from the application development team. Because the resources are completely different, the projects are not directly competing for resources. If these projects begin at the same time, the second project will almost certainly finish first (even though the first project is the higher priority) simply because the second project requires far less time to complete. However, for cases in which projects do compete directly for resources (such as two infrastructure projects), prioritization can help organizations more easily resolve resource allocation conflicts.
Existing Options for Project Evaluation
Effective project prioritization requires governing bodies to understand enough about each project and the portfolio as a whole to make rational and objective decisions. Research literature presents many traditional models for evaluating and scoring projects, including return on investment (ROI), internal rate of return, net present value, risk-adjusted net present value, and discounted cash flow.12
Within higher education, however, measuring and scoring projects based on anticipated financial returns can be difficult at best. This is because our IT teams are not always in the business of delivering applications or services that yield a direct financial return. In many cases, our projects can contribute to cost reduction via improved business processes, but in just as many cases, our projects contribute to business objectives such as student success, improved graduation rates, and improved learning outcomes. This is not to say it's impossible to determine ROI for such projects, but rather that it can be challenging.
Fortunately, some measurement techniques do not focus solely on financial results. For instance, multi-criteria decision making (MCDM) techniques — such as the simple multi-attribute rating technique and analytic hierarchy process — offer a way to measure multiple (occasionally conflicting) criteria for decision-making purposes. Such measurement techniques might be appropriate for project selection and prioritization within higher education environments.13
The Project Scoring Tool
The project scoring tool I outline here is roughly based on MCDM concepts and measures scores across two dimensions: effort and impact. In a sense, these dimensions could be considered as measuring a type of ROI in which the costs and returns are not solely financial. Many of the commercial and freely available tools used to measure and score potential projects do so within a single dimension. The distinct variables being measured might cross dimensions (or domains), but the resulting score is often presented singularly — such as "78 out of a possible 100." This method is problematic in that two projects that look vastly different (from both effort and impact standpoints) can end up with the same singular score, making comparisons difficult and time consuming.
How It Works
The project scoring tool requires answering a series of questions across both effort and impact dimensions. Each question is weighted and scored, and the overall effort/impact score is calculated and plotted on a quadrant (see figure 3). Most of the questions are brief and require users to select an answer from a predefined list. For instance, one variable of impact is the number of students that will directly benefit from the project; predefined answers include all students, many students, a moderate number of students, and so on. As another example, one variable of effort is the number of departments required to implement the project, with the predefined answers ranging from 1–2 departments to > 5 departments.
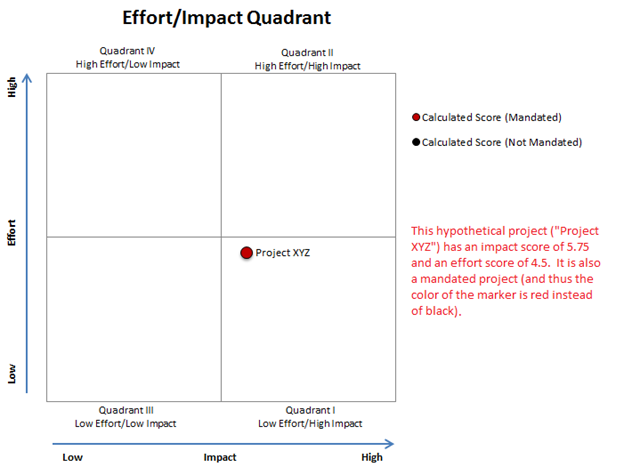
Figure 3. Overall effort vs. impact score
Tables 1 and 2 show a comprehensive list of questions and predefined answers for the impact and effort dimensions, respectively. Each question is assigned an overall weight, and each answer is assigned a score (typically in the range of 0–10 or 1–10). For brevity's sake, I don't include individual weights and scores here. Individual campuses implementing a system like this should have local conversations about appropriate weights and scores to increase the likelihood of buy-in. In any case, it is important to strike a balance between getting the weights and scores to an acceptable state and the time investment (that is, avoiding the urge to be hyper-granular).
Table 1. Impact Dimension Questions and Predefined Answers
|
Question Type |
Question |
Answers |
|---|---|---|
|
Dropdown, single-value selection |
Is this project mandated? |
Yes |
|
No |
||
|
Dropdown, single-value selection |
Does this project support university strategic priorities? |
Supports multiple priorities |
|
Supports one priority |
||
|
Doesn't support any priorities |
||
|
Dropdown, single-value selection |
Students who directly benefit: |
Doesn't affect students |
|
Few students |
||
|
Moderate number of students |
||
|
Many students |
||
|
All students |
||
|
Dropdown, single-value selection |
Faculty/staff who directly benefit: |
Doesn't affect faculty/staff |
|
Few faculty/staff |
||
|
Moderate number of faculty/staff |
||
|
Many faculty/staff |
||
|
All faculty/staff |
||
|
Dropdown, single-value selection |
Do external constituents benefit? |
Yes |
|
No |
||
|
Dropdown, single-value selection |
Annual financial savings: |
None |
|
Saves < $10k per year |
||
|
Saves $10k–$25k per year |
||
|
Saves $25k–$50k per year |
||
|
Saves > $50k per year |
||
|
Dropdown, single-value selection |
Faculty/staff time savings: |
None |
|
Saves 1–10 hrs. per month |
||
|
Saves 11–25 hrs. per month |
||
|
Saves 26–50 hrs. per month |
||
|
Saves 51–100 hrs. per month |
||
|
Saves >100 hrs. per month |
||
|
Dropdown, single-value selection |
Probability of realized benefits: |
Low probability |
|
Average probability |
||
|
High probability |
||
|
Guaranteed probability |
||
|
Dropdown, single-value selection |
User satisfaction improvement: |
None |
|
Minimal |
||
|
Moderate |
||
|
High |
||
|
Dropdown, single-value selection |
Future resource impact: |
Very low |
|
Low |
||
|
Medium |
||
|
High |
||
|
Very high |
||
|
Dropdown, single-value selection |
Net systems reduction: |
None |
|
1 system |
||
|
2 systems |
||
|
3 systems |
||
|
> 3 systems |
||
|
Dropdown, single-value selection |
Sponsor's priority: |
Low |
|
Medium |
||
|
High |
||
|
Checkboxes, multi-value selection |
Additional project outcomes/benefits: |
Project is related to health/life/safety |
|
Project supports student success |
||
|
Project reduces risk or improves security |
||
|
Project addresses a current system that is at end of life |
||
|
Project addresses a current system that is functioning but is nearing end of life |
||
|
Project automates 1 or more manual learning/business processes |
||
|
Project enables standardization of 1 or more learning/business processes |
Table 2. Effort Dimension Questions and Predefined Answers
|
Question Type |
Question |
Answers |
|---|---|---|
|
Dropdown, single-value selection |
Project scope: |
Scope is well defined, documented, and agreed to |
|
High-level scope has been documented |
||
|
Scope is undefined or unclear |
||
|
Dropdown, single-value selection |
Number of participating departments: |
1–2 departments |
|
3–4 departments |
||
|
5 departments |
||
|
> 5 departments |
||
|
Dropdown, single-value selection |
IT FTE reallocation required during implementation: |
None |
|
< 0.25 FTE |
||
|
0.25–0.5 FTE |
||
|
0.51–0.75 FTE |
||
|
0.76–1 FTE |
||
|
1–1.5 FTE |
||
|
1.5–2 FTE |
||
|
> 2 FTE |
||
|
Dropdown, single-value selection |
Non-IT FTE reallocation required during implementation: |
None |
|
< 0.25 FTE |
||
|
0.25–0.5 FTE |
||
|
0.51–0.75 FTE |
||
|
0.76–1 FTE |
||
|
1–1.5 FTE |
||
|
1.5–2 FTE |
||
|
> 2 FTE |
||
|
Dropdown, single-value selection |
Ongoing IT FTE support required: |
None |
|
< 0.25 FTE |
||
|
0.25–0.5 FTE |
||
|
0.51–0.75 FTE |
||
|
0.76–1 FTE |
||
|
1–1.5 FTE |
||
|
1.5–2 FTE |
||
|
> 2 FTE |
||
|
Dropdown, single-value selection |
Ongoing non-IT FTE support required: |
None |
|
< 0.25 FTE |
||
|
0.25–0.5 FTE |
||
|
0.51–0.75 FTE |
||
|
0.76–1 FTE |
||
|
1–1.5 FTE |
||
|
1.5–2 FTE |
||
|
> 2 FTE |
||
|
Free-form integer |
Implementation hard cost: |
Free-form integer |
|
Free-form integer |
Total hours to implement: |
Free-form integer |
|
Free-form integer |
Ongoing hard costs: |
Free-form integer |
|
Dropdown, single-value selection |
Project duration: |
< 1 month |
|
1–2 months |
||
|
3–6 months |
||
|
6–12 months |
||
|
12–18 months |
||
|
> 18 months |
||
|
Dropdown, single-value selection |
Business process changes required: |
No business process will change as a result |
|
Minimal number of business processes must change as a result |
||
|
Moderate number of business processes must change as a result |
||
|
Many business processes must change as a result |
||
|
Dropdown, single-value selection |
Complexity of implementation: |
None (routine change within 1 system) |
|
Minimal (minimal system impacts or few dependencies) |
||
|
Moderate (IT vendor interfaces, multiple system impacts, or multiple dependencies) |
||
|
High (multiple vendor interfaces, complex system impacts, many dependencies) |
Scoring Examples
Figures 4–6 show screenshots of a hypothetically scored project using Microsoft Excel. Blue cells represent the questions. The answers are shown in one of three colors: green cells, for single-value selections chosen from a dropdown; white cells, for answers typically submitted as free-form text; and red cells, for answers that are of critical visibility/interest. Figure 7 shows the project's score, based on the answers to the impact and effort questions.
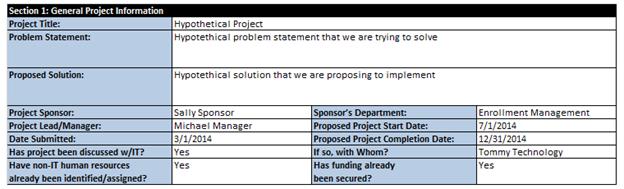
Figure 4. General project information
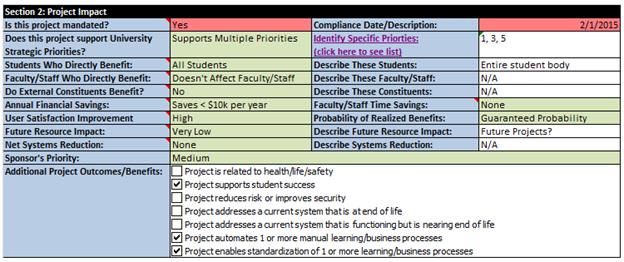
Figure 5. Impact dimension variables
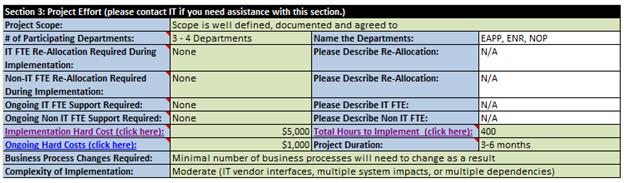
Figure 6. Effort dimension variables
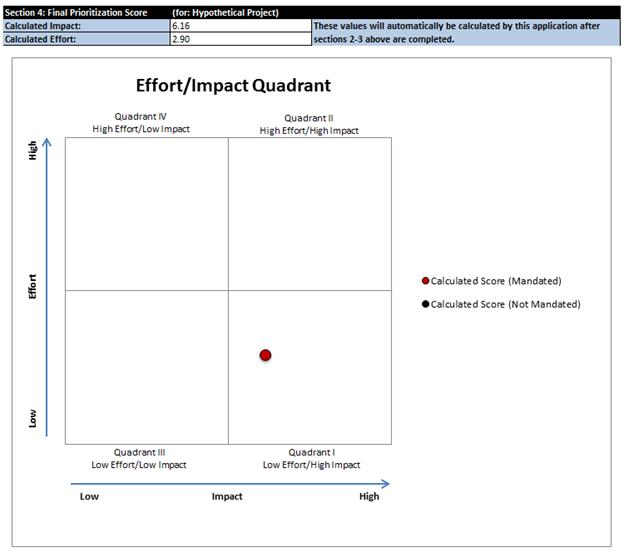
Figure 7. The calculated/plotted score, based on the impact and effort answers
Benefits
The most powerful part of the visual quadrant is that it facilitates objective conversations based on the comparative measures of potential projects. Governing bodies should review and discuss individually scored answers and overall project scores, and using a tool like this easily gives them an overall sense of the estimated effort needed to execute a project and the project's expected impact (or benefit). Although project scores can be reviewed in isolation (as in figure 3), they should really be compared to the existing projects in the portfolio pipeline (as in figure 8) to determine how to select and prioritize new projects. In this way, governing bodies can determine the most appropriate way to continually rebalance the portfolio (at whatever time interval makes sense) to best meet strategic objectives.
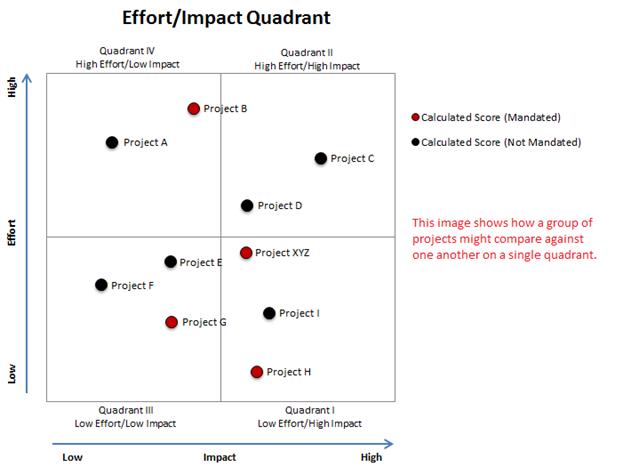
Figure 8. Comparison of project scores
Issues to Note
Use of this tool raises several issues. First, and perhaps most importantly, the tool in and of itself (or any tool like it) cannot tell you which projects your campus should select or how to prioritize them. The tool's usefulness is in providing information to stakeholders and decision makers in a meaninful visual way — through the quadrant structure — that can help generate conversation to inform decisions.
Second, it might appear at first glance that the best strategy would be to select or prioritize projects that score in Quadrant I (low effort/high impact) — specifically those in the bottom-right corner. However, selecting only Quadrant I projects would rule out many projects that will deliver value to the organization. Highly impactful projects often naturally require high levels of effort. Also, selecting only Quadrant I projects isn't necessarily strategic.
Third, for some projects, the effort/impact scores don't really matter because the project is mandated by federal, state, or local governments (and might include groups such as a system chancellor's office). A mandated project might not leave room for debate about its merit or prioritization. Given the importance and prevalance of mandate-driven projects in higher education, the tool actually accounts for this data; the color of the quadrant's plotted score indicates whether a project is mandated (red) or not (black).
Fourth, the individual variables and their respective weights were developed iteratively at two different campuses. The variables that you ultimately choose to measure on your campus should be locally meaningful; this tool simply provides a framework that helps you consider what's relevant on your own campus.
Fifth, this tool can be developed in Microsoft Excel. Although an elegant web application would be nice, Excel has all of the features needed to implement the tool as a proof-of-concept or stop-gap solution.
Finally, as a side note, it's helpful to provide a standard definition for what your organization considers a "project." You can do this using any number of variables, such as the number of anticipated hours required to complete the project, number of departments or employees involved, estimated hard costs, and so on. The specific variables you use should be locally meaningful and simple enough to provide clarity in most cases. A hypothetical definition might look something like this:
We consider a project to be any body of work that is temporary and has any combination of the following: it requires 80+ hours of IT resource time, requires coordination from 3+ departments, requires coordination with 3+ IT resources, or has hard costs of $10,000+.
Governance Framework
The project selection and prioritization governance framework that you implement will depend on your organization's current governance archetypes and on the willingness of campus leadership and the business-at-large to change them. It can be helpful to think of IT decision making as occurring within five archetypes, as outlined in table 3.14
Table 3. Five Archetypes of IT Decision Making
|
Archetype |
Input and Decisions |
|---|---|
|
Business monarchy |
Decisions are made by senior leadership (president, provost, CFO, VPs) in an executive committee or the equivalent. |
|
IT monarchy |
Decisions are made by senior IT leadership (CIO and possibly other groups of senior IT executives) within the IT organization and/or IT steering committees. |
|
Feudal |
Decisions are made autonomously by individual business unit leaders. |
|
Federal |
Decisions are made by a combination of senior leadership, senior IT leadership, business unit leaders, business process owners, and end users. |
|
Anarchy |
Decisions are made by business-process owners and end users. |
It is important to consider each archetype's role and involvement level in decision making. In some cases, particular archetypes might have decision-making authority, while in others they might play an advisory role, offering only input and recommendations. For instance, some organizations have a shared governance structure, in which a federal archetype recommends project prioritization to an IT monarchy and/or a business monarchy, which is then responsible for making the final decisions.
It is also important to consider the manner in which different types of IT projects might be initiated and how the different archetypes might field the requests/submissions. For instance, projects that are considered business-focused (such as a new software application to solve an end-business problem) might be handled differently than infrastructure-focused projects (such as a new virtual environment to replace aging physical servers).
Depending on your organization's size and complexity, you might find that a multi-tiered structure works best. In such a structure, the lower tier or tiers might prioritize projects at functional or departmental levels and submit their lists to the upper tier, which then prioritize the projects into a single master list. Figure 9 shows a simple example.
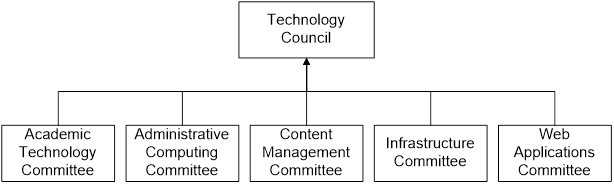
Figure 9. A simple, multi-tiered organizational chart
Challenges
Campuses that attempt to implement a new project scoring tool or governance framework like the ones I present here will likely face some opposition. Following is a list of possible hurdles and some tips for overcoming them. This list is not meant to be exhaustive, but rather covers some of the topics and concerns that I've found to be recurring.
- Hurdle 1: Users assume the project scoring tool will prioritize the project/portfolio for them. This is not the case. As I explained earlier, the tool merely calculates effort and impact scores and plots them visually on a quadrant. This lets stakeholders and governance teams compare projects to one another in an apples-to-apples manner. The tool's true value is in the conversation it generates.
- Hurdle 2: Users worry that project requestors will game the system. Here, the thinking is that, by intentionally answering impact/effort questions fraudulently, requestors might obtain an undeserved low effort/high impact score. However, if stakeholders and governing bodies discuss the scores of each project in a transparent manner, there's little chance of this strategy going unnoticed. For example, if the project requestor incorrectly states that a project will benefit "all students," it's highly likely that such a mischaracterization will be recognized and rectified.
- Hurdle 3: Users assume that projects with a low impact or high effort score (or both) will be rejected. However, there are several reasons why this might not be true, including that high impact projects often require high effort; some projects are mandated; project scores often huddle in the middle of the quadrant; and projects occasionally have high support among senior leaders in advance of (and sometimes regardless of) the scoring.
- Hurdle 4: Users assume that all project requestors view their own projects as top priority. Thus, asking project requestors or sponsors for their opinions (as a scored variable) is a waste of time. However, sponsors/requestors often self-identify their projects as medium or low priority, and will actually yield to other projects when they understand their objectives and potential impacts.
- Hurdle 5: Users assume that answering the tool's questions is too difficult and time consuming. Several things are worth considering here. First, if a sponsor isn't willing to perform basic research when requesting that resources be committed to a project, this should be a red flag. A project should be defined clearly enough that decision makers can determine if it aligns with the business strategy and decide whether resources should be committed. Second, the answers to most questions are in relatively rough ranges, so it isn't overly burdensome to answer with sufficient accuracy. Third, most sponsors/requestors should be able to answer the impact section's questions unassisted, though they will almost certainly need help from IT to answer those in the effort section.
- Hurdle 6: Users get hyper-granular on individual variable weightings and scorings. It is certainly important to discuss which variables are locally meaningful and to have general buy-in on both the weights assigned to individual questions and the scores assigned to different answers for each question. However, the idea is to get close enough that the variables, weights, and scores are meaningful in a group-wise comparison of projects. For example, you might find that it isn't critically important if a project's calculated effort score is 4.53 vs. 4.49.
- Hurdle 7: The project lacks executive leader involvement and support. This final hurdle is the most critical of all. Including an actively supporting VP (or two) somewhere in the governance structure will lend credibility. An organization that attempts to implement a visible and inclusive governing structure might face significant (and potentially insurmountable) challenges unless it has firm executive leadership backing.
Conclusions
Moving project selection and prioritization processes along a spectrum of maturity can be time consuming and complex. In the end, however, research has shown that the benefits far outweigh the challenges. When the business staff can sit in a room together with IT staff for rational project selection and prioritization conversations, PPM maturity starts to unfold. And, when that happens, IT will ultimately serve the business in a much more meaningful way.
- Project Management Institute, A Guide to the Project Management Body of Knowledge (PMBOK Guide), Project Management Institute, 2004.
- Indranil Bardhan, Sugato Bagchi, and Ryan Sougstad, "Prioritizing a Portfolio of Information Technology Investment Projects," Journal of Management Information Systems, vol. 21, no. 2 (2004), pp. 33–60; Bert De Reyck, Yael Grushka-Cockayne, Martin Lockett, Sergio Ricardo Calderini, Maricio Moura, and Andrew Sloper, "The Impact of Project Portfolio Management on Information Technology Projects," International Journal of Project Management, vol. 23, no. 7 (2005), pp. 524–537; and Daniel Smith and Richard Sonnenblick, "From Budget-Based to Strategy-Based Portfolio Management," Research Technology Management, vol. 56, no. 5 (2013), pp. 45–51.
- Mark Jeffery and Ingmar Leliveld, "Best Practices in IT Portfolio Management," MIT Sloan Management Review, vol. 45, no. 3 (April 15, 2004), pp. 41–49; and Ram L. Kumar, Haya Ajjan, and Yuan Niu, "Information Technology Portfolio Management: Literature Review, Framework, and Research Issues," Information Resources Management Journal, vol. 21, no. 3 (2008), pp. 64–87.
- Peter Weill and Richard Woodham, Don't Just Lead, Govern: Implementing Effective IT Governance, working paper No. 4237-02, MIT Sloan School of Management, 2002.
- Monideepa Tarafdar and Sufian Qrunfleh, "Examining Tactical Information Technology-Business Alignment," The Journal of Computer Information Systems, vol. 50, no. 4 (2010), pp. 107–116.
- De Reyck et al., "The Impact of Project Portfolio Management."
- Ibid.; and Tarafdar and Qrunfleh, "Examining Tactical Information Technology-Business Alignment."
- Tarafdar and Qrunfleh, "Examining Tactical Information Technology-Business Alignment."
- Smith and Sonnenblick, "From Budget-Based to Strategy-Based Portfolio Management."
- De Reyck et al., "The Impact of Project Portfolio Management."
- Jeffery and Leliveld, "Best Practices in IT Portfolio Management"; Kumar, Ajjan, and Niu, "Information Technology Portfolio Management"; Smith and Sonnenblick, "From Budget-Based to Strategy-Based Portfolio Management"; and Weill and Woodham, Don't Just Lead, Govern.
- Bardhan, Bagchi, and Sougstad, "Prioritizing a Portfolio"; De Reyck et al., "The Impact of Project Portfolio Management"; Kumar, Ajjan, and Niu, "Information Technology Portfolio Management"; and Smith and Sonnenblick, "From Budget-Based to Strategy-Based Portfolio Management."
- R. Dutta and Tom F. Burgess, "Prioritising Information Systems Projects in Higher Education," Campus-Wide Information Systems, vol. 20, no. 4, 2003, pp. 152–158.
- Weill and Woodham, Don't Just Lead, Govern.
© 2014 Lawrence Andrew Miller. The text of this EDUCAUSE Review Online article is licensed under the Creative Commons Attribution-Noncommercial 4.0 license.