
Key Takeaways
- PTEM measures a course design's success in terms of student "types" and how successfully they interact with the course.
- Using student types lets course evaluators make precise design changes that assist students who need help without altering the experience of those who are thriving with the existing design.
- Triangulating data on achievement, perception, and engagement lets faculty members better measure success — and better interpret failure.
In 2001, I published the short article "A Resource-Enriched Learning Model,"1 which described a collaborative instructional-design effort that emphasized both faculty development and a student-centered learning methodology. At the University of Connecticut, we have been using this RELM model for some time to evolve the online MS in Accounting program,2 several undergraduate and graduate business courses, and a few courses for the School of Law's LL.M. in Insurance. Yet, as successful as this innovative effort has been, my earlier article did not include the still evolving evaluation model that we use to measure its success. Now that the Phased Triangulation Evaluation Model (PTEM) is in partial use in the MS in Accounting program, I will explain it and how we use it in conjunction with RELM.
Rationale
By employing an instructional design process such as RELM, we can create student-centered course design structures. Student-centered courses focus on how students progressively construct their knowledge and abilities by using many more activities and assessment points than in traditional courses. Therefore, using a single traditional survey at the end of the course that asks students about the instructor's ability to impart information is not an effective way to evaluate such a course. (Here, I use "evaluate" in relation to measuring course success and "assessment" as a measure of student performance). Because students actively construct their knowledge by engaging the course design — rather than passively receiving knowledge through faculty oration — we must evaluate the course in terms of how its design structure enables students to achieve its predefined objectives. The fact that many of these designed courses exist online adds yet another element to measure, specifically the web design that functions as the interface students engage to construct their knowledge.
Given that RELM and other constructivist-influenced instructional design models create a new dynamic between instructors and their students, they require a course evaluation model that complements student-centered course designs and the expanding technologies that make such designs functional and available. Such an evaluation model should be both multidimensional (that is, it should consider each student's individual achievement, feedback, and effort) and continuous (it should perpetually record the data generated by each dimension, i.e. assessed activities, survey results, and online navigation). Ultimately, a course evaluation model must unite these multiple data streams with individual students and allow for the interpretation of those results in terms of each student's unique predisposition and aptitude. It thereby permits a precise evaluation of the course's comparative level of success in enabling a diverse body of students to fulfill the course's learning objectives.
To compose such a model requires a coordinated effort. First, establish a defined profile of each student's predisposition (such as personality and approach to learning) and aptitude, and then:
- Document each student's assessed level of success for each activity
- Increase the number of surveys focused on the learning design to acquire student perspectives at multiple points in the course
- Record the pattern of engagement and use of the course as it exists online
Only with these data sets in hand can we determine how well the course design, as a constructive process, has succeeded in transferring knowledge and abilities to a range of student profiles. That is, this information gives us a model that provides evidence of how well the student-centered designed course imparts its intended objectives to different profiles or "types" of students.
The Model
As Figure 1 shows, PTEM is a mixed-methods evaluation model consisting of three dimensions:
- Achievement represents a student's grades for assessed course activities and final grades.
- Perception represents a student's responses to a progression of initial, formative, and summative surveys about the course design.
- Engagement represents a student's presence, currently captured as analytical data by many learning management systems (LMSs) and navigation patterns in the online course.
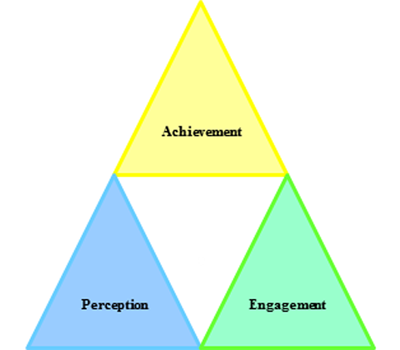

Figure 1. The Phased Triangulation Evaluation Model's Structure
PTEM then comprehensively considers these dimensions, both as three continuous, parallel streams for the duration of a course and as distinct in terms of when data appears in any one of them (see Figure 2).
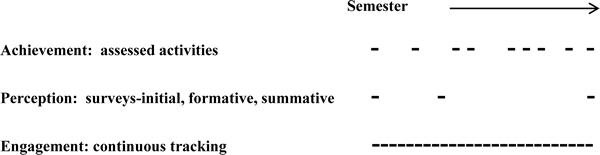
Figure 2. Timeline of PTEM Dimensions
Each student, represented as a randomly generated identifier, exists as an anonymous proxy for a unique profile consisting of a list of preferred attributes — including personal data, placement scores, and behavioral and psychological inventory outputs — that distinguishes facets of preparation and predisposition (see Figure 3).
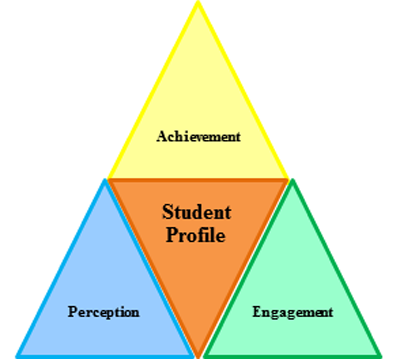
Figure 3. Student Profile Relationship to the Achievement-Perception-Engagement Dimensions
How PTEM Works
Because the model is executed in conjunction with a RELM or a similar student-centered designed course, three initial steps are required:
- Establish the preferred attributes that make up a student profile.
- Collect information from each student about each selected attribute to create his or her unique profile or type.
- Attach the qualified data to an anonymous identifier (a proxy established prior to a student's enrollment in a course).
As students progress through the course, they continuously generate data in each of the three dimensions. These data are linked to a student's anonymous identifier and recorded in the PTEM database, which functions in conjunction with the LMS. For achievement, the LMS grade book includes grades for each assessed activity connected to a course learning outcome and feeds that information directly into that dimension's partition of the PTEM database connected to a student's anonymous identifier. For perception, students' responses to survey questions — many of which are tied to an activity or learning outcome — are recorded directly in that dimension's partition for the students' proxies, which are authenticated using login information. For engagement, each time students log in to the course, their activities — that is, how they engage with and use the course — are recorded in that dimension's partition of the database, which is also connected to their anonymous identifier (see Figure 4). As a result, the three dimensions of data connected to each student's anonymous identifier provide a measure of the course design's success in meeting its objectives across student types.
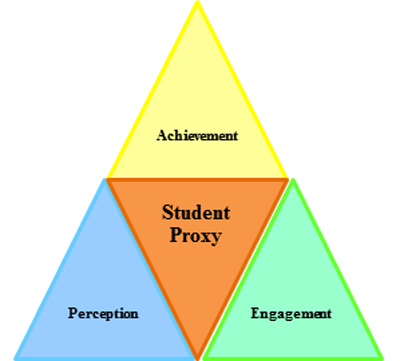
Figure 4. Student Type Data Generation
Benefits of the Model
Data collection assists in evaluating the course design's success in empowering students to construct their knowledge in terms of the student-centered learning concept. Specifically, because the model establishes a unique profile for each student based on particular qualities for each profile attribute — which collectively renders the student's type — it provides within- and between-group analyses using any single attribute or multiple attributes. This allows for a four-step diagnostic and iterative process as follows.
Step 1: Examine Data from Individual Dimensions
Examining each dimension alone yields an initial impression of the course design's relative success. For example, simply looking at achievement (that is, graded activities) in terms of student types using a single or combined set of profile attributes provides an estimate of how successful the various types are at constructing their knowledge. Reflecting on the profile attributes of less successful types (within the purview of motivation research on internal and external regulation) guided embellishment of course activities with more detailed instructions in an effort to be more sensitive to these students' proclivities and particular needs.
Looking at survey results for perception in terms of types provided insight about overlooked design issues and logistics. For example, a defined set of student types requested additional video tutorials to reinforce the written instructions.
In terms of engagement, examining usage patterns and types revealed an interesting pattern that informed a design decision for other courses. In this instance, certain types of students in a particular course accessed a faculty member's video introduction of himself and the course. Yet, other faculty had not included this design element in their courses. Subsequently, each faculty member recorded a short video introduction for their courses and placed it on the course's first page.
Step 2: Analyze Data from Two Dimensions
Pairing dimensions allows for a mutual interpretation of their results. The following four examples illustrate this opportunity.
One unexpected example involved examining achievement data in conjunction with perception data in terms of types for a particular graduate course. This process revealed that lower grades for some students were indeed a function of course design rigor (high course expectations). Yet, many of the same students said in the final course survey that they felt a deep sense of achievement. Comparing data revealed that, while issues related to this course needed attention, the course design itself was satisfactory. In this case, the prerequisite courses and their respective learning outcomes needed examination. After some discussion, it was decided that at least one of the undergraduate courses would undergo an instructional redesign. The effort provided a transparent mapping of the undergraduate course outcomes with those of the graduate course.
In another instance of examining the achievement data, this time in conjunction with engagement data, tempered the course design's success level with that of the student's actual use of the course. Patterns of use for successful and less successful types demonstrated that the latter often procrastinated, suggesting more frequent reminders to engage them with the course.
In a third example, examining perception and engagement data in terms of types permitted interpretation of students' perceptions of the course in relation to their use of it; this led to a significant change in the navigation bar designed as the interface for all MS in Accounting courses. In this instance, the summative survey for each course included a question about its respective learning objectives. Student responses to this question for all courses showed a weak awareness of any course's learning objective. Curiously, tracking data showed that students, regardless of course, almost always went to the "Class Schedule" when accessing the course, while few examined the "Learning Objectives" page. Both the survey and tracking data thus underscored the need to redesign the navigation bar and run a usability test on different versions of it for the purpose of a comparative analysis. The usability test included a navigation bar that had only the "Description" and "Learning Objectives" buttons available on signing in; to see more navigation buttons — including "Course Schedule" — students had to click on "Learning Objectives." Subsequent survey results showed that students who engaged this navigation bar not only readily acknowledged that a course was driven by a learning objective but also said they could explain what the learning objective was.
A fourth example in which pairing perception and engagement data for mutual interpretation proved informative occurred upon receipt of a significant number of negative survey results for particular questions across several courses in a semester. Tracking data on the types who provided those negative survey responses revealed a subset of students who were enrolled in each of those courses and who infrequently engaged the courses. Significant course engagement by the majority of other types — who provided positive survey responses to those same questions — challenged and mitigated the significance of those who provided negative survey responses.
Step 3: Triangulate the Dimension Data
Triangulating the dimensions simultaneously increases the precision of interpreting the results. For example, examining any type in terms of any of its attributes within the three dimensions concurrently allows us to interpret the course's success in imparting knowledge through construction as a function of its actual design, its online rendering of the design, and students' ability to navigate the design. In fact, triangulating the data across the three dimensions has led to an interesting observation:
Combining the data of those students who do not perform well on course activities, who provide negative survey results, and who fall into the lower level of engaging the course discloses a subset of student types whose mode of preference for learning is face-to-face, even though they are enrolled in an online degree program.
Results such as these give faculty usable information when weighing their formal course evaluations, which traditionally ask students to evaluate the faculty member, as the embodiment of the course, on a number of points. These student responses are subjective, as well as anonymous and indistinguishable. A faculty member who has delivered a student-centered designed course is at a disadvantage in interpreting negative data — or, for that matter, positive data — collected through such an evaluation instrument for several reasons:
- The formal course evaluation questions focus on the faculty member, not the course design or outcomes.
- The students' responses are subjective and therefore unreliable.
- To maintain anonymity, the responses lack any characteristic attributes of the individual students who provide them.
In the case above, for example, the faculty member could not discern the basis of the traditional course evaluation's negative results from the data in that instrument. By triangulating the achievement, perception, and engagement data for the course, however, the faculty member not only measured the course's success more accurately but also accurately identified and interpreted negative data.
At this point, it might appear that PTEM, in an effort to move the evaluation's focus from the faculty member to the course design, has failed to consider that the faculty member still bears responsibility for managing the students' learning. Such an appearance, however, belies the actual case: Triangulating the dimensions has shown that at times the faculty acted irresponsibly and did not perform their due diligence when delivering the course. In one newly designed course, for example, many students' grades were low for multiple activities, yet the tracking data proved that student engagement with the course was timely, frequent, and copious. Triangulating the data of achievement and engagement with perspective revealed the faculty member's lack of attention to crucial parts of the course. The survey results included complaints that activity instructions were too brief and unclear and that many links on the course pages were wrong or broken. Indeed, although PTEM measures a course's success in terms of student types and their interactions with the course design, it has not neglected the role of faculty members — albeit a guiding rather than orating role — and thus the evaluation includes their participation in the course's success.
Step 4: Measure Types Data
Ultimately, because each student continuously generates data in each of the three dimensions for the duration of the course as points on a longitudinal plane or timeline, the course's success can be measured in terms of types as any single point, pairing, or triangulation on that timeline. Examining the course data in this way permits evaluating its level of success as a progressive sequence. For example, in one course the learning outcomes were coded in terms of Bloom's cognitive taxonomy. Examining the coded outcomes by types helped in determining where the course succeeded for some types and broke down for others. To modify the course and facilitate future learning, our design solution focused on metacognition to increase students' introspection and address their locus of motivation. Specifically, the attributes of those student types who were less successful suggested that they needed to be made cognitively aware of their profile and all its attributes, the student-centered course design, Bloom's taxonomy, and the explicit labeling of all outcomes in those terms — as well as the implications of this collective effort — to reduce the variance of success. This approach was duplicated for a second course, in which students also had to reveal the attributes of their learning profiles to each other when working in groups. The value of this design solution was confirmed through a summative survey question for this course, which asked, "Have you reflected on the implications of the learning profile dimensions of others as you worked on group assignments?" A sample response included: "Understanding of these types and differences has helped me to be patient and adapt my own approach to others when difficulties arise."
Discussion
The pedagogical paradigm shift toward more active student-centered learning, combined with technological opportunity and diversity, could lead to more complex course designs across online or blended modes of instruction. Using a mixed methods evaluation model provides an expanded and nuanced context for interpreting data produced through student and course interactions.
The integrated PTEM enables the reciprocal interpretation of the unique results for achievement, perception, and engagement, and allows for a triangulation to discern the course's level of success not in terms of students as a monolith, but as individual types or groups of types. As such, the success level might be as much a function of students and their roles as the course design and its web layout. Either way, the process that generates this data functions as a diagnostic, exposing bias patterns that can be mitigated and eventually resolved through the iterative process of refining the course design. In so doing, this iterative process incrementally addresses the needs of student types who might otherwise be marginalized.
Conclusion
Because we can measure all course design elements in terms of a qualified attribute or any combination of attributes for any particular student (type) or selected student types, we can make design changes with an informed precision that assists those types that need it at no detriment to other types that are flourishing in the existing design. PTEM's ability to measure a course design's success and give particular students a structure they can engage to construct their knowledge — and thus fulfill a course's learning objective — establishes it as a more valid, reliable, and dynamic model for evaluating learning-centered online course design.
PTEM will undoubtedly be compared with Quality Matters (QM). However, while QM lets an instructor evaluate a course's quality against a rubric of best practices, the dynamics of PTEM let the instructor comparatively measure the course design's success in enabling diverse types of students to better construct their knowledge. It thus enables modification of a course to benefit all student types and improve their rates of knowledge construction and course completion.
- David Lavoie, "A Resource-Enriched Learning Model," EDUCAUSE Quarterly, vol. 24, no. 2 (April–June 2001), pp. 67–68.
- David Lavoie and Andrew J. Rosman, "Using Active Student-Centered Learning-Based Instructional Design to Develop Faculty and Improve Course Design, Delivery, and Evaluation," Issues in Accounting Education, vol. 22, No. 1 (February 2007), pp. 105–118.
© 2011 David R. Lavoie. The text of this EQ article is licensed under the Creative Commons Attribution-Noncommercial-No Derivative Works 3.0 license.