The Makeup of Today's IT Workforce
Higher education IT is a rich tapestry of groups and individuals who serve higher education at a number of organizational levels and who perform a host of roles and functions for their campuses. The higher education IT workforce is demographically complex and does not always reflect the composition of the general public. In this section, we provide some answers to this seemingly simple question: Who is the IT workforce? Thanks to the 1,592 higher education IT employees who took the time to respond to our 2018 survey, we have the answers. Knowing who "higher education IT" is can help in deciding who it wants to be in the future. This knowledge also affords opportunities to (re)consider hiring strategies that will render organizations more representative of their campuses and communities; generate awareness; develop greater sensitivity to issues of diversity, equity, and inclusion in the workplace; and assist those who may need accommodations to do their work effectively.
Organizational Level
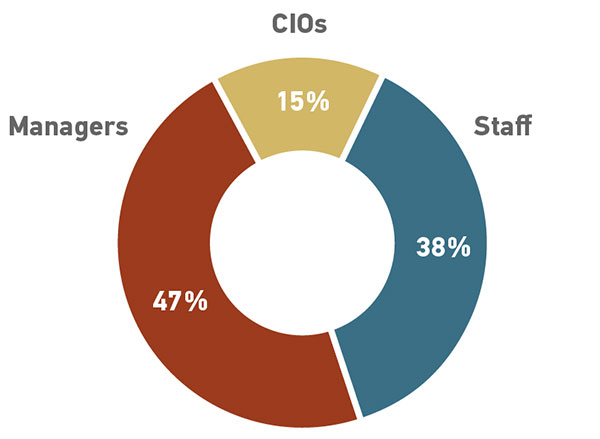
EDUCAUSE has been conducting research on the IT workforce in higher education since 2002. This report follows in the vein of our 2014 and 2016 predecessors in that it does not focus simply on IT leadership (CIOs) but also on non-CIO managers (managers) and nonmanagerial staff (staff).1 In this way, the scope of this research project is broadly inclusive of the entire higher education IT workforce.
In our sample, respondents self-reported the distribution as follows: 246 (15%) are CIOs (or equivalent), 745 (47%) are managers or supervisors, and 601 (38%) are IT staff (see figure 1). Although this sample may not be representative of the composition of higher education IT, it does offer us enough statistical power to generalize and offer recommendations within those categories. To that end, we give a considerable amount of attention to this tripartite distinction along organizational lines.
Gender
In the United States, women make up 50.9% of the population and men make up 49.1%.2 In many ways, however, this is where equity for men and women ends. Women continue to find themselves politically, socially, and economically unequal to men nearly five decades after the passage of the Equal Rights Amendment (ERA)3 and almost a quarter of a century after the Fourth World Conference on Women issued the Beijing Declaration:
- Women are paid only 80% of what men are paid for the same work.4
- Women pay more for common household items than men (a.k.a. the Pink Tax).
- Women hold only 24% of the 535 seats in Congress.5
- Women are outnumbered by men in the news media, producing only 37% of the content and reporting on only 25% of stories.6
- Women are CEOs of only 24 (4.8%) of the Fortune 500 companies and only 25 (5%) of the Standard & Poor's 500 companies.7
- Women constitute only 29% of the overall elite tech sector workforce.8
- Women make up only 26% of the computing workforce.9
And, unfortunately, this imbalance persists in the field of higher education IT.
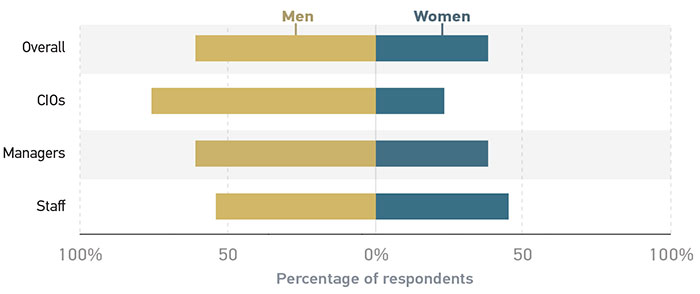
The percentage of women in higher education IT in 2018 lags behind official US Department of Labor statistics that show women constituting 43% of the overall full-time workforce.10 In our 2018 sample, women made up only 38% of the overall higher education IT workforce (see figure 2), a percentage that is similar to our samples in previous years. Broken down by organizational level, however, the percentage of female managers is now at 38%, representing a 25% increase in the past two years. The proportion of female staff has increased from 40% in 2016 to 45%. The gains experienced by women in IT managerial and staff positions are offset somewhat by a decrease in the number of women holding CIO positions: 23% in 2018 versus 27% in 2016. The numbers of women in the IT workforce we identified surpass the 26% in the computing workforce identified by the American Association of University Women (AAUW) in 2015,11 the 27% of computing and information systems managers noted by the Bureau of Labor Statistics,12 and the aforementioned 29% among elite tech sector companies. Despite these relative gains and the somewhat favorable comparisons, considerable work remains to promote gender equity in higher education IT.
The AAUW has published the Playbook on Best Practices for promoting gender equity in the IT world.13 Drawing on research and practice, the Playbook provides "a set of specific strategies and actions that have been shown to measurably increase the representation of women in the engineering and computing professions." Generally, the three broad sets of strategies (under each of which are more specific, detail-oriented approaches) include the following:
- Supporting an inclusive talent pipeline by changing the culture, stereotypes, and perception of technology careers
- Building equity into the culture and process of recruiting talent—for example, "using neutral language in job postings, conducting blind interviews, using panels, and having objective criteria for deciding whom to hire"
- Creating and sustaining a culture that supports the success of everyone—for example, "having high-level leaders prioritizing gender equity, defining and measuring specific goals toward gender equity, providing professional development, and addressing implicit biases"14
The strategies in the AAUW Playbook could be very useful for addressing gender inequity in the higher education IT workforce.
Age and Generation
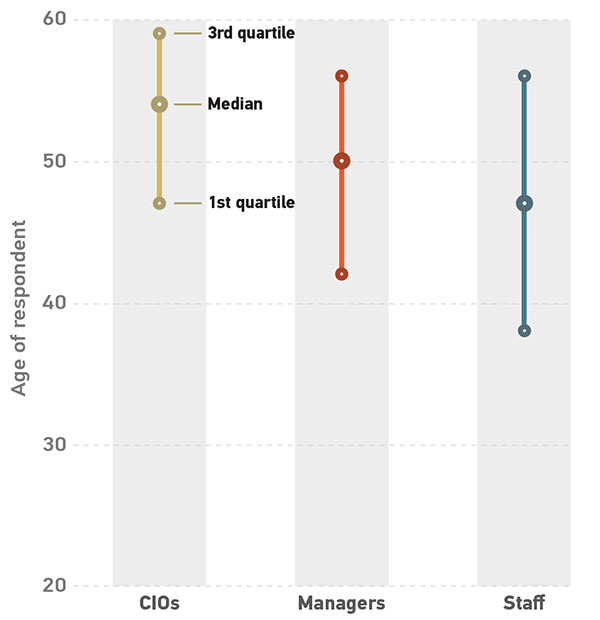
Based on the data we collected, the higher education IT workforce is getting older. In 2018, the median age of higher education IT employees was 50, exactly two years more than when we reported on it two years ago. And, the typical employee continues to be older (by about eight years) than the typical US worker.15 Employees' ages vary, of course, reflecting an increase in age as one moves up the organizational ladder (see figure 3). CIOs are, on average, the oldest group of IT employees, with a median age of 54. None of the CIOs in our sample was under 30—the middle 50% of CIOs were 47 to 59. The age distribution of IT managers looks remarkably similar to that of higher education IT employees overall. The typical manager is 50, and the middle half of all managers are 42 to 56; the under-30 manager is a rare commodity, representing only 1% of the managers in our sample. Higher education IT staff are the youngest group, but their age has increased more than that of CIOs or managers in the same period. Only 6% of higher education IT staff are younger than 30, and the median staff age has increased by four years, to 47.
Grouping the IT workforce by generation16 reinforces the findings above: older employees (Boomers and Gen Xers) are more likely to be CIOs and managers than younger (Millennials) higher education IT workers (see figure 4). It also helps to hammer home the additional and concerning findings that the higher education IT workforce is 1) atypical of the general population and 2) not getting any younger. First, the generational distribution of higher education IT employees looks nothing like that of the rest of the US labor force. According to a 2018 Pew Research Center study, Millennials are now the largest generation in the workforce, constituting 35% of the labor pool. They are followed closely by Gen Xers (33%) and more distantly by Baby Boomers (25%).17 Baby Boomers and Gen Xers are overrepresented in the higher education context, while Millennials are underrepresented by a factor of two-thirds.
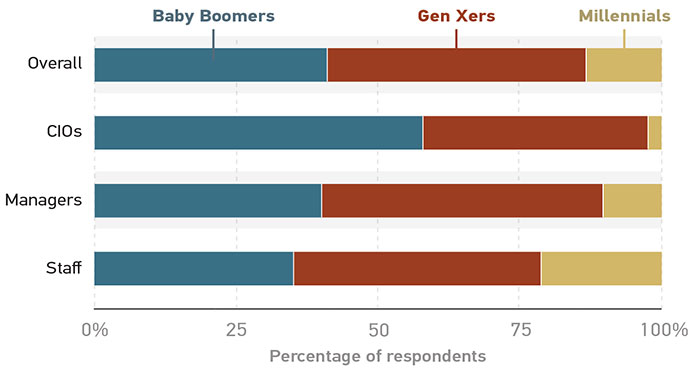
Similar stability in generational stratification persists for the CIO and managerial levels. However, staff age level has increased significantly. The proportion of Baby Boomers among higher education IT staff positions increased by five percentage points since 2016, while the percentage of Gen Xers fell by five points and the percentage of Millennial staff remained unchanged. It is entirely possible that our survey undersampled and thereby underrepresents Millennials in our data set. If this is the case, our concerns about generational replacement may be somewhat mitigated; if, however, our data reasonably represent the generational composition of the higher education IT workforce, the implications for workforce maintenance—much less growth—going forward are potentially serious.
Why might Millennials not be entering the IT workforce at colleges and universities? We cannot know the answer for certain, but one strong contender may be that private sector IT employers may simply have deeper pockets than higher education institutions. Although all generations ranked "quality of life" as their top factor in keeping them at their respective institutions, Millennials were significantly more likely than Gen Xers (by 9%) and Baby Boomers (by 17%) to say that monetary compensation was very or extremely important. This finding dovetails with a recent report by Deloitte on Millennials in the workplace that found that pay was the top priority when considering an employer.18 That same study also provides additional insights into what Millennials are looking for when selecting employers: quality of life and salary may attract Millennials into positions, but they stay for employers' commitments to diversity and flexible working conditions.
In an era of shrinking budgets for higher education and clear salary limits based on human resources (HR) job classifications, it may remain difficult to initially attract Millennial talent. Understanding what may attract and retain Millennials is a good first step toward addressing generational replacement.19 We already know, for example, that some Millennials are souring on private sector businesses, with fewer saying they believe business leaders are committed to helping improve society and more saying they believe the sole ambition of businesses is to make money. As a result, higher education IT organizations may be able to take advantage of this disaffection by focusing on how colleges and universities help improve society, do more than seek revenue, and look out for society's interests. Additionally, IT organizations that cannot work with HR to transcend more traditional models of employment to accommodate telecommuting, remote working, and flexible hours options may also be at a disadvantage in recruiting and retaining younger staff. Implementing new and innovative approaches to developing and maintaining their workforces by focusing on creating flexible working conditions and promoting diversity and generational equity in the workplace may put higher education IT organizations in a better position to address the inevitable challenges of generational replacement.
Ethnicity
Our survey found that the overall higher education IT workforce remains predominantly white (83%) (see figure 5), a percentage that considerably exceeds that of the US labor force (78%)20 and the larger civilian IT labor force (70%).21 Modest improvements in the ethnic diversification of the higher education IT workforce are continuing, but this trend is comparatively slower for managerial and CIO-level positions than for staff (see table 1).
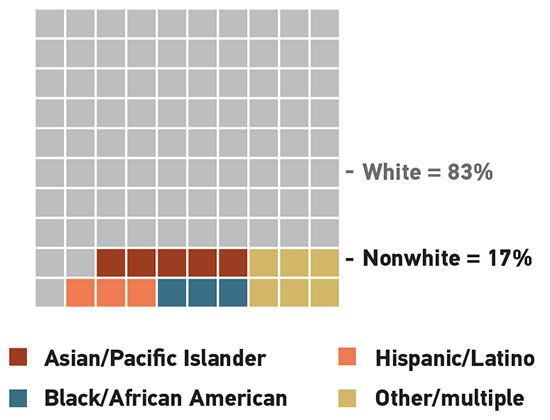
Table 1. Percentages of nonwhite higher education IT professionals, 2010–18
| 2010 | 201422 | 201623 | 2018 | |
|---|---|---|---|---|
| CIOs | 4% | 13% | 15% | 16% |
| Managers | 8% | 13% | 15% | 16% |
| Staff | 10% | 12% | 15% | 18% |
Although a technical degree is not necessarily a requirement for IT roles, computer science education may serve as a useful proxy to gauge the ethnic disparities we observe. The percentage of whites among computer science majors dropped from 83% in 1992 to 62% in 2016, while the percentage of minority computer science majors increased,24 suggesting a decrease in racial/ethnic disparities among these majors. Moreover, the percentage of potential IT employees (based on degrees earned in the field) suggests that the ethnic disparity in the higher education IT workforce should be less than it is. White students accounted for only 53% of information technology degrees awarded in 2016; comparatively, black students earned 15% of IT degrees, Hispanic students earned 13%, and Asian students earned 9% of the same degrees.25 Put simply, higher education IT can do better when it comes to the recruitment, retention, and promotion of ethnic minorities. The $64,000 question is, of course, "How?"
The solution to the problem of minority underrepresentation in the higher education IT workforce depends largely on the source(s) of the problem. We may see fewer minorities working in higher education IT due to structural constraints. For example, the socioeconomic status of minority populations may limit opportunities for early (K–12) access to computing resources to develop the skills for and interest in entering the field of information technology. Or, and possibly relatedly, there may not be a large enough pool of minorities in the local labor force with the technical skills required to work in higher education IT. Neither of these explanations is, however, satisfactory. In the case of the former, we have already noted that larger numbers of minorities are majoring in and graduating with degrees in computer science despite structural disadvantages they may have had growing up. In the case of the latter, minority underrepresentation in IT professions persists even in areas (metropolitan) where minority populations are sizable.26 Another source of minority underrepresentation in higher education IT may be institutional procedures related to hiring, retention, and promotion. There are any number of ways in which bias can be introduced into the hiring process, including where jobs are advertised, whether the language in job advertisements is inclusive (or exclusive), how candidates' resumes are screened and reviewed,27 the manner in which interviews are conducted, and/or how salaries and benefits are negotiated.
Finally, the cultural sources of potential inequity in higher education IT may be the most difficult to overcome. A recent groundbreaking study by the Kapor Center for Social Impact (KCSI) on why people voluntarily leave jobs in the tech field appears to confirm that IT work environments can be toxic, "characterized by bullying, stereotyping, sexual harassment, and racial bias."28 The "unfair treatment" identified as the single largest reason people leave the technology field is manifest in ways that disproportionately affect minority employees and women. For example:
- Men of color were more likely to leave due to unfairness (40%).
- Men and women of color were twice as likely as white or Asian men and women (25%) to have experienced stereotyping.
- Women of color were passed over for promotion more than any other group (almost 33%).29
Those experiencing unfairness, stereotyping, and/or bullying were more likely to leave and/or stay employed at their jobs for shorter periods of time.
While difficult to address, this culture can be improved by implementing changes to institutions, processes, and practices.30 When it comes to recruiting minority candidates, for example, higher education IT organizations can take these steps:
- Advertise positions more broadly and move beyond known networks to recruit.
- Demonstrate explicitly their (and the institution's) commitment to diversity.
- Review candidates' resumes or CVs blindly (i.e., without names or other identifiers).
- Maximize the number of individuals who interview candidates to reduce the impact of any single individual.
- Develop a mechanism that allows for anonymous candidate reviews and interrater reliability to be assessed.
- Extend the same offer package to all candidates.
In addition to these basic alterations to the recruitment process, the difficult work of changing individual and aggregated attitudes, beliefs, and behaviors may require more long-term efforts. In their report on "tech leavers," the KCSI researchers recommended the following:
- Implement comprehensive diversity and inclusion strategies that have unconditional support from organizational leadership and assess the impact of those strategies.
- Create inclusive cultures based on a set of core values, establish a code of conduct, and continuously evaluate the workplace culture.
- Develop effective and fair management processes that include auditing performance evaluation and compensation practices for potential biases and implementing management training and bias-mitigating strategies.
These approaches are resource intensive, and it may take some time to reap the benefits. However, such efforts are more likely to have a lasting impact than issuing a string of diversity reports lacking initiatives to act upon their findings31 or hiring an executive-level chief diversity officer.32
Sexual Orientation
For the first time since beginning our workforce research in 2010, we collected data on the sexual orientation of higher education IT employees. Doing so allows us to better understand and be responsive to the experiences and needs of these individuals. Even if we do not work with or are not aware that we work with people who are LGBQ,33 we hope that our efforts make IT employees cognizant of their presence in the broader higher education IT community.
Despite the fact that general IT culture has been demonstrated to be somewhat hostile to members of the LGBQ community,34 the percentage of LGBQ higher education IT employees is practically twice that of the general population. Among our survey respondents in 2018, 5% self-identified as gay, 3% as bisexual, 1% as queer, and another 1% as another sexual orientation. The remaining 91% of the population self-identified as straight.35 According to a recent Gallup report, 4.5% of US adults self-identified as LGBT in 2017.36 This percentage has been steadily increasing since tracking began in 2012, when 3.5% self-identified as such. Why this percentage is greater in higher education IT is up for speculation: perhaps colleges and universities are inherently more attractive to those who are LGBQ given their broader commitment to diversity of thought, creed, and demography, or perhaps higher education IT departments are comparatively less hostile to LGBQ employees than the tech sector studied by KCSI.37 This may be more likely given that only 4% of LGBQ respondents (compared with 9% of those who identified as straight) said their next job will be outside higher education. Regardless, given that legal protection for sexual orientation varies considerably by state, there is ample opportunity for discrimination, bullying, and harassment to erupt unchecked even on college campuses. Understanding that nearly 10% (or more, if this information is disclosed) of your workforce may belong to the LGBQ community will hopefully elicit proactive measures within IT units to promote respect for everyone in the workplace, leading to increased productivity, retention, and collaboration.
Disabilities
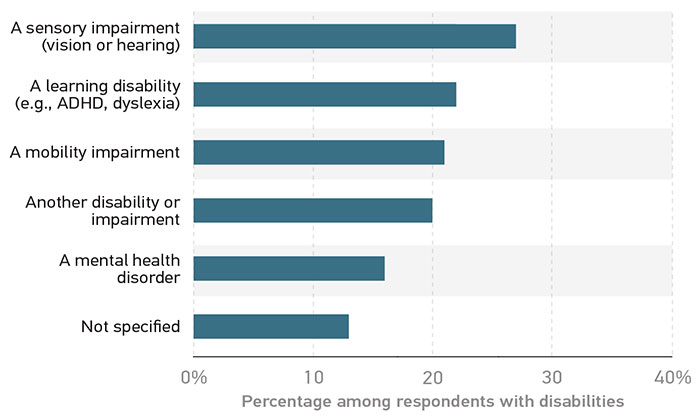
With our increased focus on issues related to diversity, equity, and inclusion, we also collected data for the first time about the disability status of IT professionals. About 8% of the higher education IT workforce reported having been diagnosed with a disability or impairment, a percentage that is less than half of the 19% of the 2017 employment rate reported by the US Bureau of Labor Statistics.38 Within our survey sample, 27% have a sensory impairment (vision or hearing), 22% have a learning disability (e.g., ADHD, dyslexia), 21% have a mobility impairment, and 16% have a mental health disorder39 (see figure 6). Twenty percent have another disability or impairment, and 15% reported having some combination of two or more of these disabilities or impairments. Also of note is that 10% of respondents declined to tell us whether they have a disability or an impairment, which puts us at risk of underreporting the overall percentage.
The number of our colleagues who live with disabilities and impairments is substantial, regardless of whether they choose to disclose them or whether we know of them. Providing accommodations to those who require them to perform their work is not merely a moral or ethical issue—it is a legal one. The Americans with Disabilities Act requires that employers make reasonable workplace accommodations, and those who fail to do so run the risk of litigation. While institutional failure to provide the necessary accommodations when disabilities are disclosed is unacceptable, some individuals choose not to disclose their disability out of fear of discrimination.40 Therefore, institutions may never be aware of an employee's specific needs. This lack of disclosure may be one of the reasons the unemployment rate for people with disabilities (9.2% in 2017) is more than two times that of those without disabilities.41 Unfortunately, many higher education institutions continue to fail at meeting the accessibility requirements for their employees, especially for basic accommodations such as the provision of accessible websites and electronic and information technology (EIT) procurement.42 How then might higher education IT organizations create an environment that is both welcoming and responsive to the needs of those with disabilities?
For this to happen, higher education IT has to establish and maintain an inclusive and equitable culture for those with disabilities or impairments. Fortunately, a considerable number of resources are available to help organizations develop such a culture. The Employee Assistance and Resource Network (EARN) on Disability Inclusion has developed and published "A Framework for Building a Disability-Inclusive Organization" that includes tips and advice for everything from building the pipeline and recruiting, to providing reasonable accommodations, to having accessible information and communication technologies. The US Department of Labor43 and the Job Accommodation Network's JAN Workplace Accommodation Toolkit are just two of many additional resources that might prove valuable in the hiring of individuals with disabilities.
Notes
-
We use the term "organizational level" throughout this report to refer to all three of these respondent types.
↩︎ -
Lindsay M. Howden and Julie A. Meyer, "Age and Sex Composition: 2010," 2010 Census Briefs (Washington, DC: US Department of Commerce, 2011), 2.
↩︎ -
The ERA was passed by Congress in 1972 but has yet to be ratified by the requisite three-quarters (currently 38) of the states for it to become constitutional law. In 2018, Illinois became the most recent state to ratify the ERA. For more information on the ERA, see https://en.wikipedia.org/wiki/Equal_Rights_Amendment.
↩︎ -
Kevin Miller, The Simple Truth about the Gender Pay Gap, AAUW, n.d .
↩︎ -
According to the Center for American Women and Politics, "25 women (25%) serve in the U.S. Senate, and 102 women (23.4%) serve in the U.S. House of Representatives. Four women non-voting delegates (2D, 2R) also represent American Samoa, the District of Columbia, Puerto Rico, and the Virgin Islands in the United States House of Representatives." For more, see "Women in the U.S. Congress 2019."
↩︎ -
Women's Media Center, The Status of Women in the U.S. Media, 2017, March 21, 2017.
↩︎ -
See Emily Stewart, Women Are Running for Office in Record Numbers, Vox, June 8, 2018, and Catalyst, Women CEOs of the S&P 500 [https://www.catalyst.org/knowledge/women-ceos-sp-500], respectively.
↩︎ -
The percentage of women in leadership (23%) and technical (16%) roles in the largest tech companies is much lower than the overall average. See Roger Cheng, "Women in Tech: The Numbers Don't Add Up," CNET, May 6, 2015.
↩︎ -
See the National Center for Women & Information Technology.
↩︎ -
US Department of Labor, Full-Time and Part-Time Employment, n.d.
↩︎ -
American Association of University Women, Solving the Equation: The Variables for Women's Success in Engineering and Computing (Washington, DC: AAUW, 2015).
↩︎ -
US Bureau of Labor Statistics, "Women in the Labor Force: A Databook," BLS Reports, no. 1065, April 2017.
↩︎ -
Kathleen Buse, Nicole Evans, Emma George, Jeremy Ford, and Jessica Anderson, Playbook on Best Practices: Gender Equity in Tech (Washington, DC: AAUW, 2017).
↩︎ -
Ibid., 2–3.
↩︎ -
In 2017, the median age of the US workforce was 42.2 years. See "Labor Force Statistics from the Current Population Survey."
↩︎ -
In 2018, we continue the practice of drawing up generational definitions as delineated by the Pew Research Center. The definitions used in this report are as follows: Millennials (born 1981–1997), Gen Xers (born 1965–1980), and Baby Boomers (born 1946–1964). For more information, see Pew Research Center, The Generations Defined, May 8, 2015.
↩︎ -
Richard Fry, Millennials Are the Largest Generation in the U.S. Labor Force (Washington, DC: Pew Research Center, April 2018).
↩︎ -
Deloitte, The Deloitte Millennial Survey 2018, n.d.
↩︎ -
Sitara Kurian, Meet the Millennials, KPMG, June 2017.
↩︎ -
US Bureau of Labor Statistics, "Labor Force Characteristics by Race and Ethnicity, 2017," August 2018; and US Bureau of Labor Statistics, "Labor Force Statistics from the Current Population Survey," January 19, 2018.
↩︎ -
Julia Beckhusen, Occupations in Information Technology: American Community Survey Reports (Washington, DC: US Census Bureau, August 2016), 13.
↩︎ -
Jacqueline Bichsel, Today's Higher Education IT Workforce, research report (Louisville, CO: ECAR, 2014).
↩︎ -
Jeffrey Pomerantz and D. Christopher Brooks, The Higher Education IT Workforce Landscape, 2016, research report (Louisville, CO: ECAR, April 2016).
↩︎ -
Ben Bours, "Women and Minorities in Tech, By the Numbers," Wired, March 27, 2018.
↩︎ -
Data USA, Information Technology: STEM Major, n.d.
↩︎ -
Mark Muro, Alan Berube, and Jacob Whiton, Black and Hispanic Underrepresentation in Tech: It's Time to Change the Equation (Washington DC: Brookings Institution, March 28, 2018).
↩︎ -
Marianne Bertrand and Sendhil Mullainathan, "Are Emily and Greg More Employable Than Lakisha and Jamal? A Field Experiment on Labor Market Discrimination," NBER Working Paper No. 9873 (Cambridge, MA: National Bureau of Economic Research, July 2003).
↩︎ -
Allison Scott, Freada Kapor Klein, and Uriridiakoghene Onovakpuri, Tech Leavers Study: A First-of-Its-Kind Analysis of Why People Voluntarily Left Jobs in Tech (Oakland: Kapor Center for Social Impact, April 27, 2017), 3.
↩︎ -
Ibid., 4.
↩︎ -
See Jennifer R. Keup, Arianne A. Walker, Helen S. Astin, and Jennifer A. Lindholm, "Organizational Culture and Institutional Transformation," ERIC Digest (Washington, DC: ERIC Clearinghouse on Higher Education, 2001); and Robert Rohrschneider, Learning Democracy: Democratic and Economic Values in Unified Germany (New York: Oxford University Press, 1999).
↩︎ -
Melanie Ehrenkranz, "For Minorities in Tech, Workplace Discrimination Begins before They Even Arrive," Mic, October 13, 2016.
↩︎ -
Steven W. Bradley, James R. Garven, Wilson W. Law, and James E. West, "The Impact of Chief Diversity Officers on Diverse Faculty Hiring," NBER Working Paper No. 24969 (Cambridge, MA: National Bureau of Economic Research, August 2018).
↩︎ -
LGBQ is an initialism that stands for lesbian, gay, bisexual, transgender, and queer. Transgender was not included in our questions regarding sexual orientation, but was included in our question regarding gender identity.
↩︎ -
Scott, Klein, and Onovakpuri, Tech Leavers Study, 4. This study found that "LGBTQ employees were most likely to be bullied (20%) and experience public humiliation or embarrassment (24%)."
↩︎ -
Note that totals do not sum to 100% due to rounding.
↩︎ -
The Gallup poll asked the question, "Do you, personally, identify as lesbian, gay, bisexual, or transgender?" While this item differs in an important way from ours, the Gallup data are the best available for comparison at a national level.
↩︎ -
One respondent told us that they stay in higher education for both "job security" and a "sense of safety as an LGBTQ person."
↩︎ -
US Bureau of Labor Statistics, "Persons with a Disability: Labor Force Characteristics Summary," June 21, 2018.
↩︎ -
This number tracks slightly below the one in five individuals who the National Institute of Mental Health identifies as living with a mental illness.
↩︎ -
Sarah von Schrader, Valerie Malzer, and Susanne Bruyère, "Perspectives on Disability Disclosure: The Importance of Employer Practice and Workplace Climate," Employee Responsibilities and Rights Journal 26, no. 4 (December 2014), 237–255.
↩︎ -
US Bureau of Labor Statistics, "Persons with a Disability: Labor Force Characteristics–2017."
↩︎ -
See "IT Accessibility Risk Statements and Evidence" and "IT Accessibility Risk Statements and Evidence by Topic."
↩︎ -
US Department of Labor, Hiring People with Disabilities.
↩︎