User Support
User support is not for the faint of heart. In fact, supporting campus IT users has become increasingly complex as the number and type of devices have increased on campus. The EDUCAUSE Center for Analysis and Research (ECAR) 2017 Undergraduate Students and Information Technology research found that at least 19 of 20 students own a laptop or a smartphone. Three in 10 students own a laptop, a smartphone, and a tablet. ECAR's companion research on Faculty and Information Technology, 2017 found similar levels of multiple-device ownership: 48% of faculty own a desktop; 69% own a laptop; 65% own a tablet; and 93% own a smartphone. Fully 26% of faculty own all four devices. Staff members also bring personally owned devices to campus. It stands to reason that all these users, at one time or another, connect these devices to campus networks and use them for teaching, learning, or other campus-related activities. Institutional IT units must provide easy-to-use IT resources and services in a complicated environment that can include a mix of institutionally owned and personally owned devices, creating additional challenges for application management and support.
Not only end users need support. Academic departments and other campus units may require IT organizations to support a number of different specialized technologies and services. IT units must navigate an increasingly complicated set of technologies and services to support user needs and growing user demands for the "anytime, anywhere, anyhow" ability to get their work done.
This section covers the 4 trends and 10 technologies included in the user support domain. Given the proliferation of devices and services that end users demand, it is no wonder that service management and managing mobility (of people, data, and institutional resources) are trends that continue to influence how institutions approach offering user support services.
Trends
Included in this domain:
- Managing mobility (of people, data, institutional resources)
- Reduced reliance on service desk as the primary model for support
- Service management (ITSM, ITIL)
- Shared services
Understand how the most influential trends are affecting your institution.
Zero trends are influential at 61% or more of colleges and universities.
Review the trends that are taking hold and address them at your institution.
Three trends are influential at 41–60% of institutions (listed below from highest to lowest level of influence):
- Service management (ITSM, ITIL)
- Managing mobility (of people, data, institutional resources)
- Shared services
Understand these trends, and consider their possible role at your institution.
The influence of zero trends is limited to 21–40% of institutions. Higher education is monitoring these trends with respect to emerging IT strategy and the deployment of user support strategic technologies.
The remaining trend is of limited impact in our research:
- Reduced reliance on service desk as the primary model for support
Technologies
Included in this domain:
- Institutional support for public-cloud storage (e.g., Box)
- Institutional support for speech recognition
- Integration/uses of voice-user interfaces
- IT accessibility assessment tools
- IT asset management tools (e.g., CMDB)
- Mobile device management
- Service-level reporting tools
- Support for use of personal cloud services
- Tools to support cross-institutional and international collaborations
- Tools to support cross-institutional and international research data-sharing
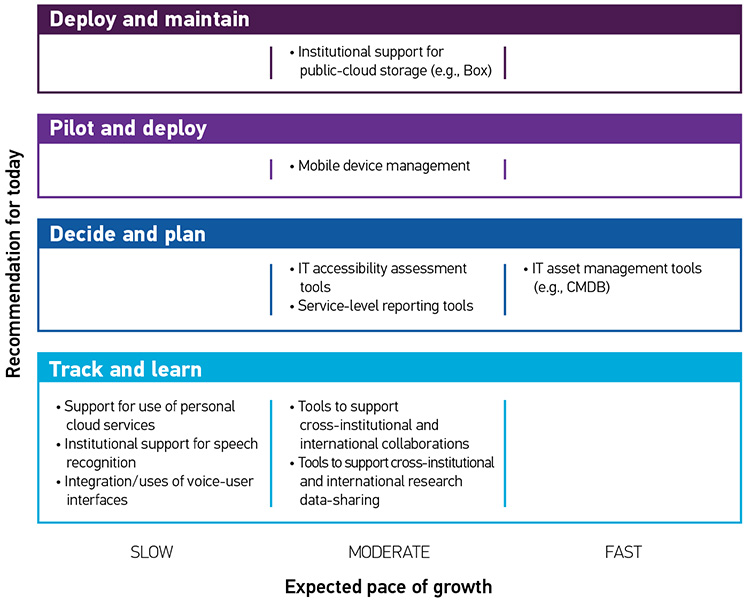
Complete initial deployment and maintain these technologies.
Our research shows that about half of institutions are planning to deploy and maintain one user support strategic technology:
- Institutional support for public-cloud storage (e.g., Box)
Pilot and start deploying these technologies.
At this time, almost half of institutions are planning to pilot and deploy one user support strategic technology:
- Mobile device management
Decide when these technologies fit your strategy, and start planning.
About one-half of institutions are watching these three user support strategic technologies carefully, deciding and planning for potential future deployment (listed below from highest to lowest attention):
- IT asset management tools (e.g., CMDB)
- IT accessibility assessment tools
- Service-level reporting tools
Learn about and track these technologies.
About one-half to two-thirds of institutions are tracking and learning about the following five user support strategic technologies (listed below from highest to lowest attention):
- Tools to support cross-institutional and international collaborations
- Tools to support cross-institutional and international research data-sharing
- Support for use of personal cloud services
- Institutional support for speech recognition
- Integration/uses of voice-user interfaces
Peer Institution Approach to Strategic Technologies
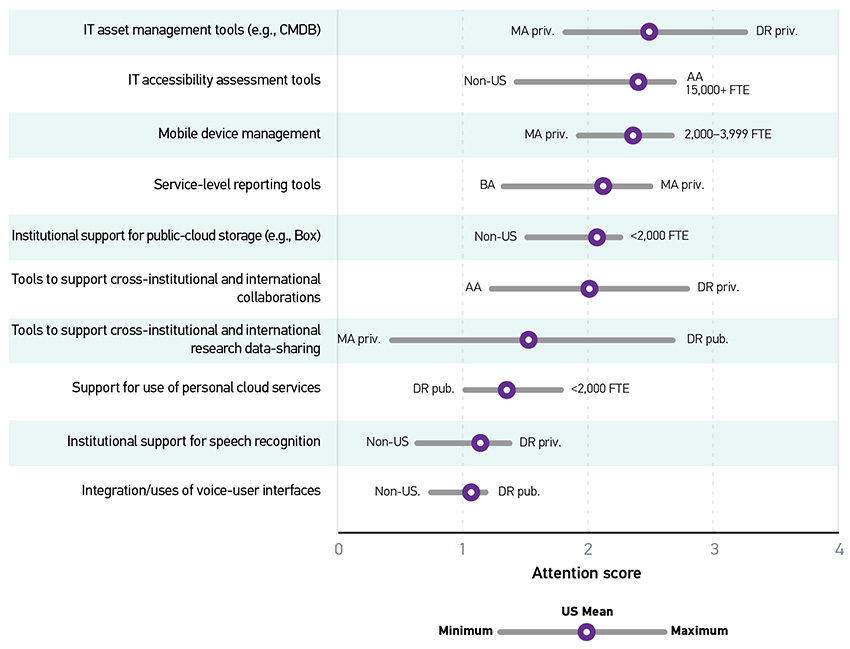
Understanding what peer institutions (both current and aspirational) are doing can help you gauge whether your institution's current approach is on track or might warrant reconsideration. Some technologies are more relevant for some types of institutions than others. We looked at broad demographic categories, including Carnegie class, institutional size, and approach to technology adoption and found differences in attention score based on those factors. (See the methodology section for explanation of our attention score calculation.) In figure 17, the US mean is the average attention score for an item from all US respondents. The minimums and maximums are the lowest and highest average attention scores among all groups within the categories of Carnegie class, institution size, and timing of technology adoption, with labels indicating which group or groups returned that score. In the event of a tie, all tied groups are represented.
Preparing for the Future
Understanding the technologies that are most relevant for your institution and how fast a certain strategic technology may be growing is critical to institutional IT strategy. We estimated the pace of growth based on the percentage of institutions we predict will implement each technology over the next five years (by 2023). Figure 18 positions each technology in one of 12 cells based on institutional intentions (the "recommendation for today") and the expected pace of growth of that technology. Reflecting what was noted above, the figure shows that half of the technologies we tracked are still being explored—rather than deployed—by most institutions.