Accessibility in Teaching and Learning
Assistive technologies can lend a great deal of support—and in some cases are necessities—whether for mobility, facilitating communications, or otherwise granting full access to people with physical and cognitive disabilities. In other cases, technology can pose barriers to persons with disabilities, such as when applications limit access and usability. High-profile legal action against institutions including UC Berkeley (over the accessibility of its online content) and Notre Dame (over the accessibility of its website) have shined a public spotlight on these potential issues and helped elevate expectations that institutions will be more responsive and accommodating to persons with disabilities.
Student experiences with technology and teaching and learning at their institution can offer windows into the extent and quality of an institution's care and attention to accessibility. Online learning tools that are inaccessible to persons with sensory impairments, for example, can significantly diminish those students' ability to thrive in their courses, as well as impede their psychological sense of belonging and value to the institution. Student lack of awareness of the accessibility resources that are available to them could be an indication of a lack of or ineffectiveness in student communications and outreach.
As higher education continues to evolve its online and hybrid learning models in particular, the inclusivity and accessibility of those learning models will be an important consideration for both faculty and students. Student needs may be more or less easily accommodated in particular modalities and for particular activities, and a deeper understanding of precisely what those needs are and how to support them will help ensure all students are included and supported as institutions adapt to the future.
Assessments of Technology Supports and Experiences
Students who reported having a disability or an impairment were asked to indicate whether they had any of four types of disabilities or impairments:
- Learning disability
- Mental health disorder
- Mobility impairment
- Sensory impairment
For students reporting any of these types of disabilities or impairments, their assessments and experiences of the technology supports and services provided by their institution differed significantly from the experiences of other students, almost always in negative ways.
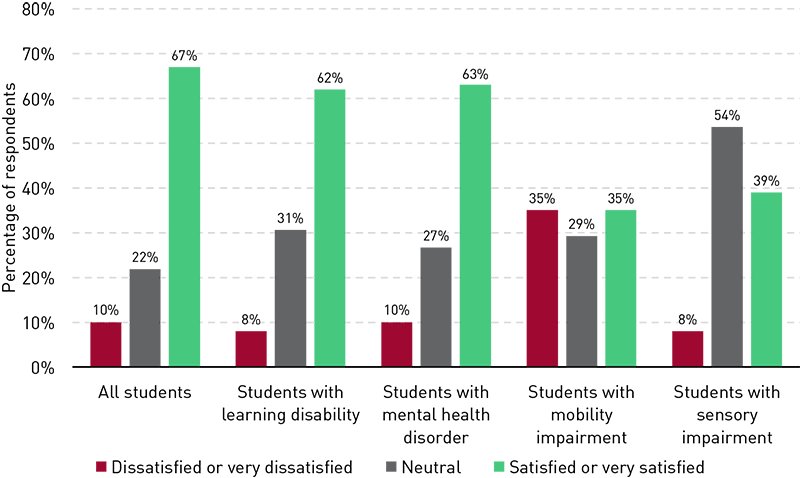
Asked to rate their overall satisfaction with the technology supports and services at their institution, 67% of all students indicated that they were either satisfied or very satisfied. Among students reporting a disability or impairment, satisfaction drops only slightly to 62% for students with a learning disability and 63% for students with a mental health disorder, but it plummets to a mere 35% for students with a mobility impairment and 39% for students with a sensory impairment (see figure 6).
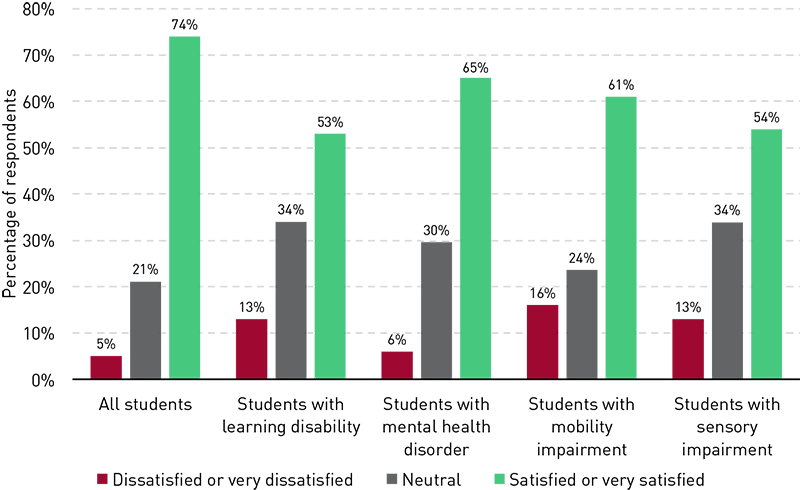
These students' assessments of their instructors' use of technology in the classroom also differed significantly from the general student population. Among all students, 74% reported satisfaction with their instructors' use of technology to engage them in their coursework. This figure drops to 53% for students with a learning disability, 65% for students with a mental health disorder, 61% for students with a mobility impairment, and 54% for students with a sensory impairment (figure 7).
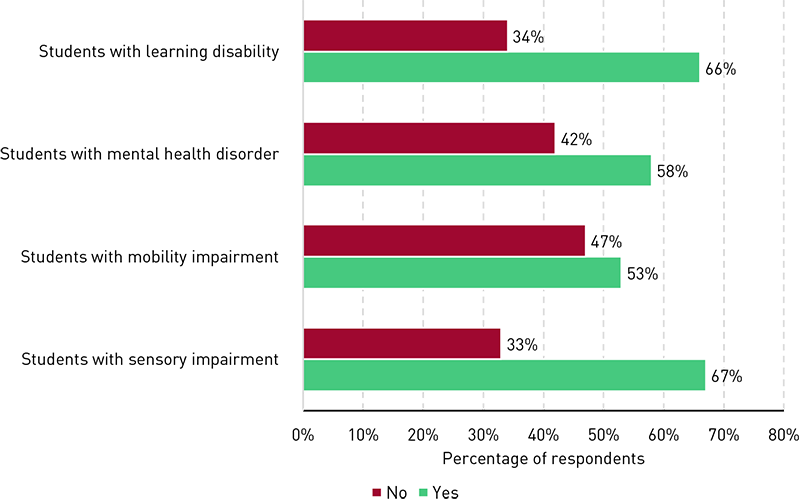
Among other factors, these students' overall assessments of their institution and instructors may be related to the specific supports they receive or don't receive from their institution's accessibility or disabilities office, and to whether the student has applied for or received approval for those supports. Indeed, sizable segments of these student populations indicated that they have not registered with their institution's accessibility or disability office: 34% of students with a learning disability, 42% with a mental health disorder, 47% with a mobility impairment, and 33% with a sensory impairment (see figure 8).
Though myriad reasons might explain why a student would not be registered with the campus accessibility or disability office, the most common reason, "I don't think the disability office has resources that would help me," was selected by 37% of students with a disability or impairment. There may be an opportunity for institutions to help raise the visibility of the resources that are available to the students who need them, and indeed, student comments about areas for improvement in disability supports focused on the need for better communication and more awareness:
"Explaining the process and options available to me."
"Be more informative to what is offered because I was never told the school had resources I could use until my 2nd year."
"Perhaps list common apps that are often required or helpful for courses and give instructions on how to acquire and use them."
"Maybe to be more communicative about the resources that it already has. I personally don't know what resources there [are] within my institution."
So what? Technology isn't the only factor enriching or diminishing the experiences of students with disabilities or impairments, but it is one factor that is within the power of the institution to directly assess, influence, and evolve to the benefit of those students. Institutions should first evaluate the availability of assistive technologies and supports and, if available, their reach and effectiveness in supporting the students who need them.
Learning Modality Preferences and Experiences
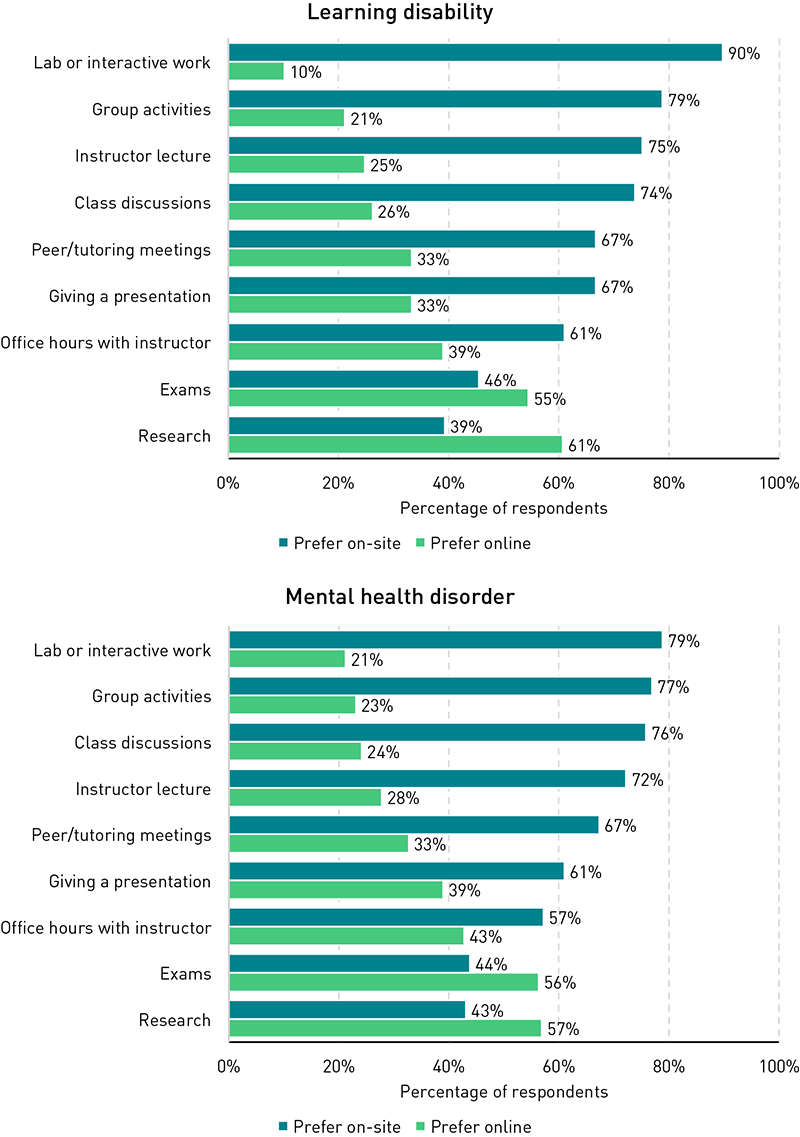
Students' accessibility needs, tied as they are to technology-related accommodations for engaging in their courses, may also influence their learning modality needs and preferences and their overall experiences engaging in hybrid courses. In particular, students with a learning disability and students with a mental health disorder expressed a strong preference for on-site course experiences in general and for certain on-site course-related activities specifically (see figure 9). Whereas 53% of all students agreed that they prefer traditional, on-site course experiences overall, this figure increases to 73% for students with a learning disability and 67% for students with a mental health disorder. A closer look at preferences related to specific course-related activities may help explain why these students have a stronger preference for on-site course experiences. Of particular interest to these students, being on-site for the instructor's lecture, for lab and interactive work, and for class discussions seem to be especially important.
Given these stronger on-site preferences, it is not surprising that students with a learning disability and students with a mental health disorder also expressed significantly lower overall satisfaction with their hybrid learning experiences. Compared with the 66% satisfaction rate among all students, only 49% of students with a learning disability and just 48% of students with a mental health disorder were satisfied with their hybrid course experiences.
Again, though, empowering students with the choice of modality in how they engage in hybrid courses can go a long way to improving their experiences in those courses. When their instructor allows these students to choose the modality for engaging in hybrid course activities, satisfaction improves to 86% for students with a learning disability and 74% for students with a mental health disorder.
So what? Students' needs for assistive technologies and other accommodations from their institution lay bare both the potential and the shortcomings of institutions' technology supports in ways that perhaps few other facets of student identity can. Accessibility mashes together the differences of student life circumstances (theme 1) and the ethical imperative of student choice (theme 2) in a denouement in this final theme of the report that should leave institutions with, more than anything, a resolve to listen to, understand, and, finally, empower their students in ways that enable, rather than restrict, their success in their courses and beyond.