The CIOs
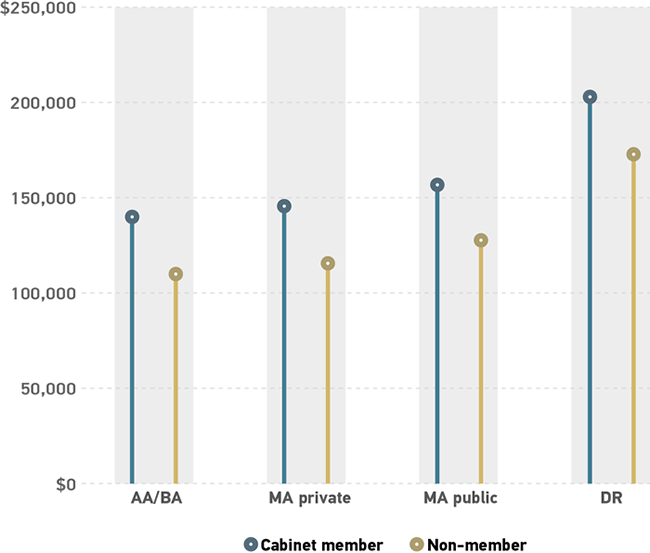
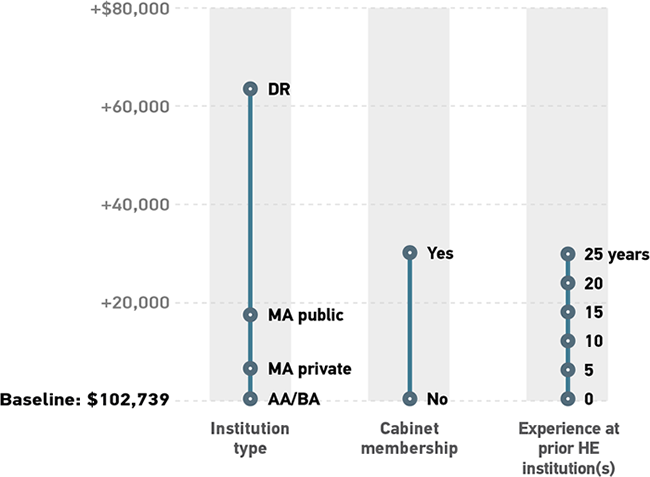
CIOs have one of the most complicated jobs in higher education IT, but predicting what a CIO earns is remarkably simple. Only three of the factors in our model predict CIO salaries significantly: institution type, cabinet membership, and years of experience in higher education prior to one's current institution. That is, after controlling for all of the other factors we considered, only these three significantly predict CIO salaries. As may be expected, CIOs at certain types of institutions—and particularly doctorals—earn more than those at other types. An average CIO at a doctoral institution is estimated to earn $63,608 more than a similar CIO at an AA institution. The increased influence that accompanies a seat on the president's or chancellor's cabinet is associated with a salary increase of $30,138. Previous ECAR workforce research found that one must often change institutions to obtain the coveted CIO position.1 Additionally, we find that the number of years of experience at previous institutions is associated with higher salaries once in a CIO position. We estimate that each additional year of experience is associated with a higher salary in the amount of $1,182 upon moving into a CIO position at a different institution. Figure 22 shows estimated average salaries for CIOs.
Though institution type, cabinet membership, and years of experience at prior institutions are strongly associated with CIO salaries (figure 3), this model accounts for only 34% of observed variability in CIO salaries. That is, two-thirds of the variation in CIO salary remains unexplained. The uncertainty in predictions resulting from this model suggests that there are factors beyond those captured in this survey that affect CIO salaries. While some of those factors may be random, unmeasurable, and/or unknowable, we can speculate about the ones that might improve our ability to predict CIO salaries. For example, we know that political and critical-thinking skills, relationship-building and collaborative skills, business skills, and other skills are deemed important.3 Understanding the variations in CIOs' possession of these skills might improve our modeling of how CIO salaries are determined. In the meantime, we recommend that CIOs who want to improve their salary consider (1) seeking a position with an institution that has the capacity to pay its CIO more, (2) seeking a position with an institution at which the CIO is a cabinet-level position, and/or (3) advocating that one's current responsibilities include a position on the president's or the chancellor's cabinet.
Notes
-
Joseph D. Galanek, Dana C. Gierdowski, and D. Christopher Brooks, The Higher Education IT Workforce Landscape, 2019, research report (Louisville, CO: ECAR, February 2019): 31.
↩︎ -
Estimated average salaries represent a CIO with six years of prior experience in higher education at another institution (add/subtract $1,182 for each year).
↩︎ -
Jeffrey Pomerantz, IT Leadership in Higher Education, 2016: The Chief Information Officer, research report (Louisville, CO: ECAR, March 2017).
↩︎