The Pieces of the Puzzle: Salary Predictors
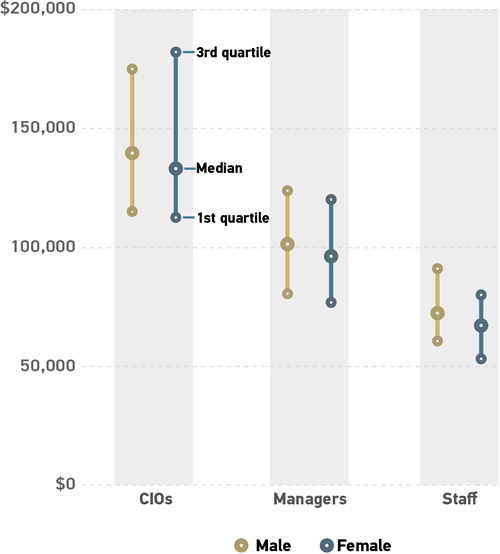
What impact do demographic factors have on salary?1 We find evidence that suggests gender inequity is no longer an issue for CIOs and managers at the univariate level. There is no statistically significant difference between the average salaries earned by male ($150,053) and female ($150,753) CIOs, nor is there one between average male ($106,548) and female ($102,203) IT manager salaries (figure 1). Unfortunately, we find that a salary gap persists between male ($77,177) and female ($69,001) staff members. However, there is no single higher education IT sector that is contributing to the overall imbalance between male and female staff members, and we found no statistically significant differences in salary between any of the ethnicities on which we gathered data (Black, White, Hispanic, Asian, or Other/Multiple).
We did find, however, that education level is significantly and positively associated with salary. Higher education IT professionals who have earned a PhD or other terminal degree ($118,883) earn significantly more than those who hold master's ($102,312), bachelor's ($92,491), associate's ($70,435), or other ($79,255) degrees.2
Not Too Cool for School
Average salaries of IT employees, by education level:
- PhD or other terminal degree: $118,883
- Master's: $102,312
- Bachelor's: $92,491
- Associate's: $70,435
- Other degree: $79,255
Our analysis also supports the general hypothesis that older employees earn more. We found significant differences in average salaries across the three generations of employees we studied: Baby Boomers ($112,070) earn significantly more than either Gen Xers ($97,444) or Millennials ($70,503). Of course, simply being older does not automatically translate into minting more coin; age, rather, is a proxy for experience, although not necessarily a direct one. We find that years in higher education is significantly but weakly correlated with salary, but that salary is not significantly predicted by years at one's current institution or years in one's current position.
Talkin' 'bout My Generation!
Average salaries of IT employees, based on generation:
- Baby Boomers: $112,070
- Gen Xers: $97,444
- Millennials: $70,503
In terms of institutional characteristics, salaries of higher education IT employees at most institution types are not significantly different from one another. Doctoral institutions are the one exception, where the average salary ($115,644 at private doctorals, $98,833 at public doctorals) is significantly higher than at other institution types ($92,130).
Two other factors need to be considered for those with managerial responsibilities beyond those of IT staff. First, our data suggest that the number of direct reports an individual has translates into greater responsibilities and that greater responsibility translates into higher salary levels. Since both CIOs and managers have direct reports, we explored the relationship between the number of direct reports and salary and found that there is, in fact, a significant and positive correlation—that is, we would expect that the more direct reports one has, the larger the salary.
The other variable of consideration is for CIOs only. Given the variation in organizational structures across colleges and universities, some CIOs hold a seat on their president's or chancellor's cabinet while others do not. CIOs who hold a cabinet post at their institution ($163,708) earn more than those who do not ($139,675). Higher percentages of CIOs on a president's or a chancellor's board engage more in strategic activities—for example, discussing the IT implications of institutional decisions with senior leadership, and shaping or influencing institutional administrative and strategic decisions. The extra responsibilities and greater influence that accompany board membership do, in fact, translate into higher salaries.
Get on Board!
Average salaries of CIOs by cabinet appointment:
- CIOs with cabinet posts: $163,708
- CIOs without cabinet posts: $139,675
Finally, we examined manager and staff positions by IT sector with the notion that different higher education IT sectors would require different skills, levels of education, and experience, and that demand would vary. The results are somewhat complicated, as we identified and asked about 11 higher education IT sectors in our survey; nevertheless, some trends emerged from the bivariate comparisons. In general, higher education IT managers who hold positions in data, analytics, and business intelligence; information security and services; research computing/cyberinfrastructure; and executive leadership have higher salaries. Managers in academic computing/instructional technology; design, media, and web; and desktop services and client support have lower salaries.
These bivariate analyses are built on the initial salary research we conducted in 2016. Once again, we found that several of the original demographic and situational factors continue to predict salary, and we identified some new variables that are significantly correlated with recent salary data.3 However, each of these discrete relationships tells only part of the story, since bivariate summaries allow each individual predictor to be vetted on a superficial level. To really understand the relationship of these factors to salary, we need to consider their collective and simultaneous impact on salary determination. By including each of these factors in salary models respective of organizational levels, we garner a sense of how important and viable each factor is when accounting for the other factors.
Notes
-
We first explore the bivariate relationships between these factors and salary at each organizational level. While these are valuable for understanding the impact of certain factors one at a time, they are limited, as the impact of one variable can mask the impact of others. To overcome these limitations, we use a multiple regression model in the second half of the report to adjust for the impact of our independent factors on salary simultaneously. This can have the effect of amplifying certain relationships and muting others. The model selection method we use in this report results in reduced theoretical models in a similar fashion to those developed in the 2016 report.
↩︎ -
"Other" is defined as vocational or occupational school certificate, high school diploma or equivalent, or other degree/credential.
↩︎ -
Brooks and Arroway, Higher Education IT Salary Report, 2016.
↩︎