Student Success (iPASS) Technologies
Residing at the intersection of analytics, mobile, and teaching and learning, student success (iPASS, or integrated planning and advising for student success) technologies1 have quickly moved from obscurity to a place of prominence among higher education IT strategic technologies in a little over five years. Initially comprising four areas,2 the concept of iPASS evolved to include education planning, progress tracking, and reforming advising/counseling as part of a broader movement of developing student success initiatives. Depending on the particular institution, the student success initiatives may focus on either the general student population or target specific groups and may include some combination of the following: general academic success; efficiency of degree or certificate completion; monitoring and managing the student pipeline (admissions and recruitment); student ability to afford higher education; and career pathways and post-graduation outcomes. As the #2 IT issue for 2018 (for the second year in a row), the focus on student success appears to be a domain in which strategic technologies (i.e., #8, institutional level predictive analytics, and #10, student success planning systems) are well situated to support ongoing efforts.
This section covers the 17 trends and 10 technologies included in the student success domain. This domain is bolstered primarily by the two highly influential trends of student success focus/imperatives and data-driven decision making and secondarily by a sextet of trends that are commanding the attention of higher education institutions.
Trends
Included in this domain:
- Blending of roles and blurring of boundaries between IT and academic/administrative areas
- Business process redesign
- Changing enterprise system architectures, integrations, and workflows
- Changing faculty roles
- Concerns about institutional sustainability or survival
- Data-driven decision making
- Digital enterprise strategy
- Diversity, equity, and inclusion
- Institution-wide data management and integrations
- IT as an agent of institutional transformation and innovation
- National and global political uncertainty
- Strategic relationships with vendors
- Student success focus/imperatives
- Ubiquitous digital sources and streams
- Use of algorithms to influence institutional and individual choices
- User-centered design
- Vendor relationships that bypass IT
Understand how the most influential trends are affecting your institution.
Two trends are influential at 61% or more of colleges and universities:
- Student success focus/imperatives
- Data-driven decision making
Review the trends that are taking hold and address them at your institution.
Six trends are influential at 41–60% of institutions (listed below from highest to lowest level of influence):
- Institution-wide data management and integrations
- Business process redesign
- IT as an agent of institutional transformation and innovation
- Changing enterprise system architectures, integrations, and workflows
- Strategic relationships with vendors
- Diversity, equity, and inclusion
Understand these trends, and consider their possible role at your institution.
The influence of six trends is limited to 21–40% of institutions. Higher education is monitoring these trends with respect to emerging IT strategy and the deployment of student success strategic technologies (listed below from highest to lowest level of influence):
- Blending of roles and blurring of boundaries between IT and academic/administrative areas
- Concerns about institutional sustainability or survival
- User-centered design
- Digital enterprise strategy
- Vendor relationships that bypass IT
- Ubiquitous digital sources and streams
The remaining three trends were of limited impact in our research:
- Changing faculty roles
- National and global political uncertainty
- Use of algorithms to influence institutional and individual choices
Technologies
Included in this domain:
- Flexible interactive platforms for descriptive and predictive analytics of institutional data
- Mobile apps for enterprise applications
- Mobile apps for institutional BI/analytics
- Predictive analytics for student success (institutional level)
- Predictive learning analytics (course level)
- Student success planning systems
- Technologies for improving analysis of student data
- Technologies for offering self-service resources that reduce advisor workloads
- Technologies for planning and mapping student educational plans
- Uses of APIs
Complete initial deployment and maintain these technologies.
Our research shows that most institutions are not ready to deploy these student success strategic technologies. Consider initial deployment only if one of these technologies is essential to your student success strategy.
Pilot and start deploying these technologies.
At this time, a majority of institutions are planning to pilot and deploy these seven student success strategic technologies (listed below from highest to lowest attention):
- Uses of APIs
- Mobile apps for enterprise applications
- Technologies for improving analysis of student data
- Technologies for planning and mapping student educational plans
- Predictive analytics for student success (institutional level)
- Student success planning systems
- Technologies for offering self-service resources that reduce advisor workloads
Decide when these technologies fit your strategy, and start planning.
A majority of institutions are watching this one student success strategic technology carefully, deciding and planning for potential future deployment (listed below from highest to lowest attention):
- Flexible interactive platforms for descriptive and predictive analytics of institutional data
Learn about and track these technologies.
A majority of institutions are tracking and learning about the following two student success strategic technologies (listed below from highest to lowest attention):
- Predictive learning analytics (course level)
- Mobile apps for institutional BI/analytics
Peer Institution Approach to Strategic Technologies
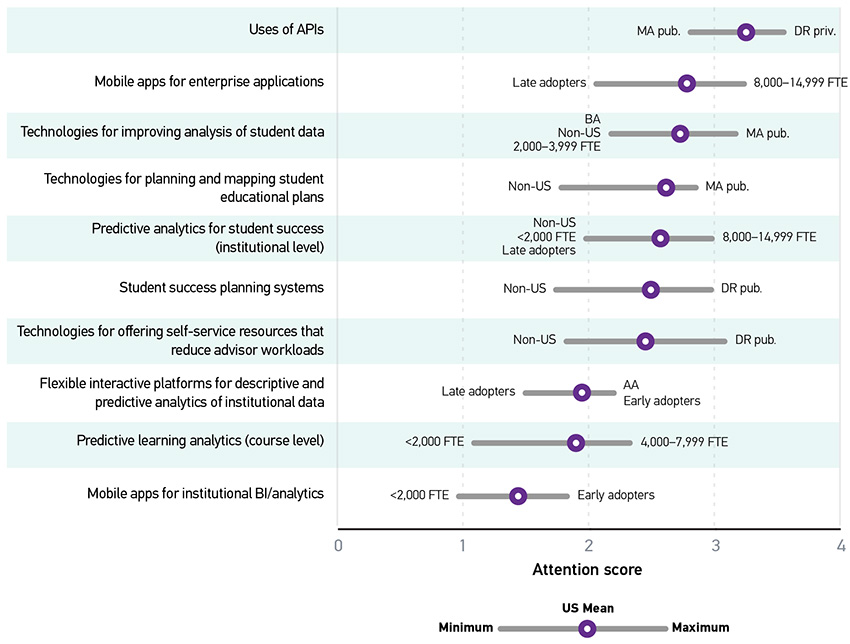
Understanding what peer institutions (both current and aspirational) are doing can help you gauge whether your institution's current approach is on track or might warrant reconsideration. Some technologies are more relevant for some types of institutions than others. We looked at broad demographic categories, including Carnegie class, institutional size, and approach to technology adoption and found differences in attention score based on those factors. (See the methodology section for explanation of our attention score calculation.) In figure 13, the US mean is the average attention score for an item from all US respondents. The minimums and maximums are the lowest and highest average attention scores among all groups within the categories of Carnegie class, institution size, and timing of technology adoption, with labels indicating which group or groups returned that score. In the event of a tie, all tied groups are represented.
Preparing for the Future
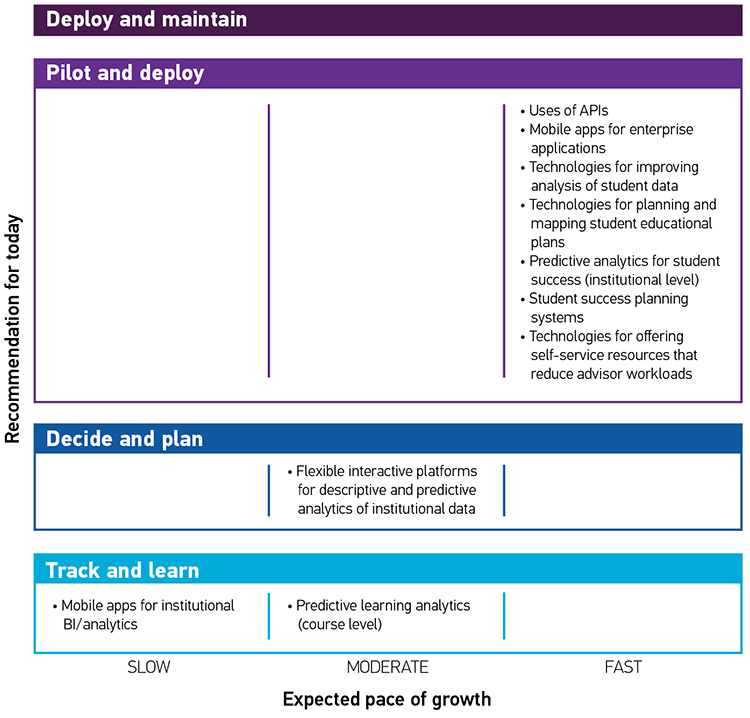
Understanding the technologies that are most relevant for your institution and how fast a certain strategic technology may be growing is critical to institutional IT strategy. We estimated the pace of growth based on the percentage of institutions we predict will implement each technology over the next five years (by 2023). Figure 14 positions each technology in one of 12 cells based on institutional intentions (the "recommendation for today") and the expected pace of growth of that technology. Reflecting what was noted above, the figure shows that most of the technologies we tracked are reaching the deployment stage at most institutions.
Notes
-
This domain was called iPASS technologies in 2017. We changed the name in the 2018 to "student success technologies" to more properly reflect the different types of technologies included in this category.
↩︎ -
In 2017, EDUCAUSE renamed integrated planning and advising services (IPAS) to integrated planning and advising for student success (iPASS) to more accurately reflect changes to the tools and areas of focus.
↩︎