The Impact of AI on Work in Higher Education

Support for this content is provided by Zoom, a 2026 EDUCAUSE Mission Partner. As the sponsor for this report, Zoom had no editorial influence on the content.
Introduction
In recent years, the higher education community has been exploring how AI tools are impacting the ways we learn, work, and live. Focus has largely been placed on student-facing impacts such as academic integrity and personalized learning, but AI is touching every area of the institution. As the higher education community continues to explore the impacts AI technologies are having on all aspects of institutional operations, EDUCAUSE presents this report on the impacts AI is having on the work of higher education, an effort conducted in partnership with AIR, NACUBO, and CUPA-HR. In this research, we summarize work-related institutional AI strategies, policies, and guidelines; the risks, opportunities, and challenges associated with using AI for work in higher education; and specific examples of how staff and faculty use—and want to use—AI for work. The survey for this project was disseminated from September 29 to October 13, 2025, resulting in 1,960 responses meeting inclusion criteria.
AI Definition and Scope
For the purposes of this research, we asked survey respondents to consider the definition of AI proposed by the EU AI Act: "A machine-based system that is designed to operate with varying levels of autonomy and that may exhibit adaptiveness after deployment, and that, for explicit or implicit objectives, infers, from the input it receives, how to generate outputs such as predictions, content, recommendations, or decisions that can influence physical or virtual environments." Note that this definition includes, but is not limited to, generative AI. We also asked respondents to consider "work related" to be anything pertaining to the work they do on a day-to-day basis and "AI tools" to refer to software that is either primarily powered by AI (e.g., ChatGPT, Copilot) or has some features that are powered by AI (e.g., Canva, Acrobat).
Key Findings
Strategies, Policies, and Guidelines
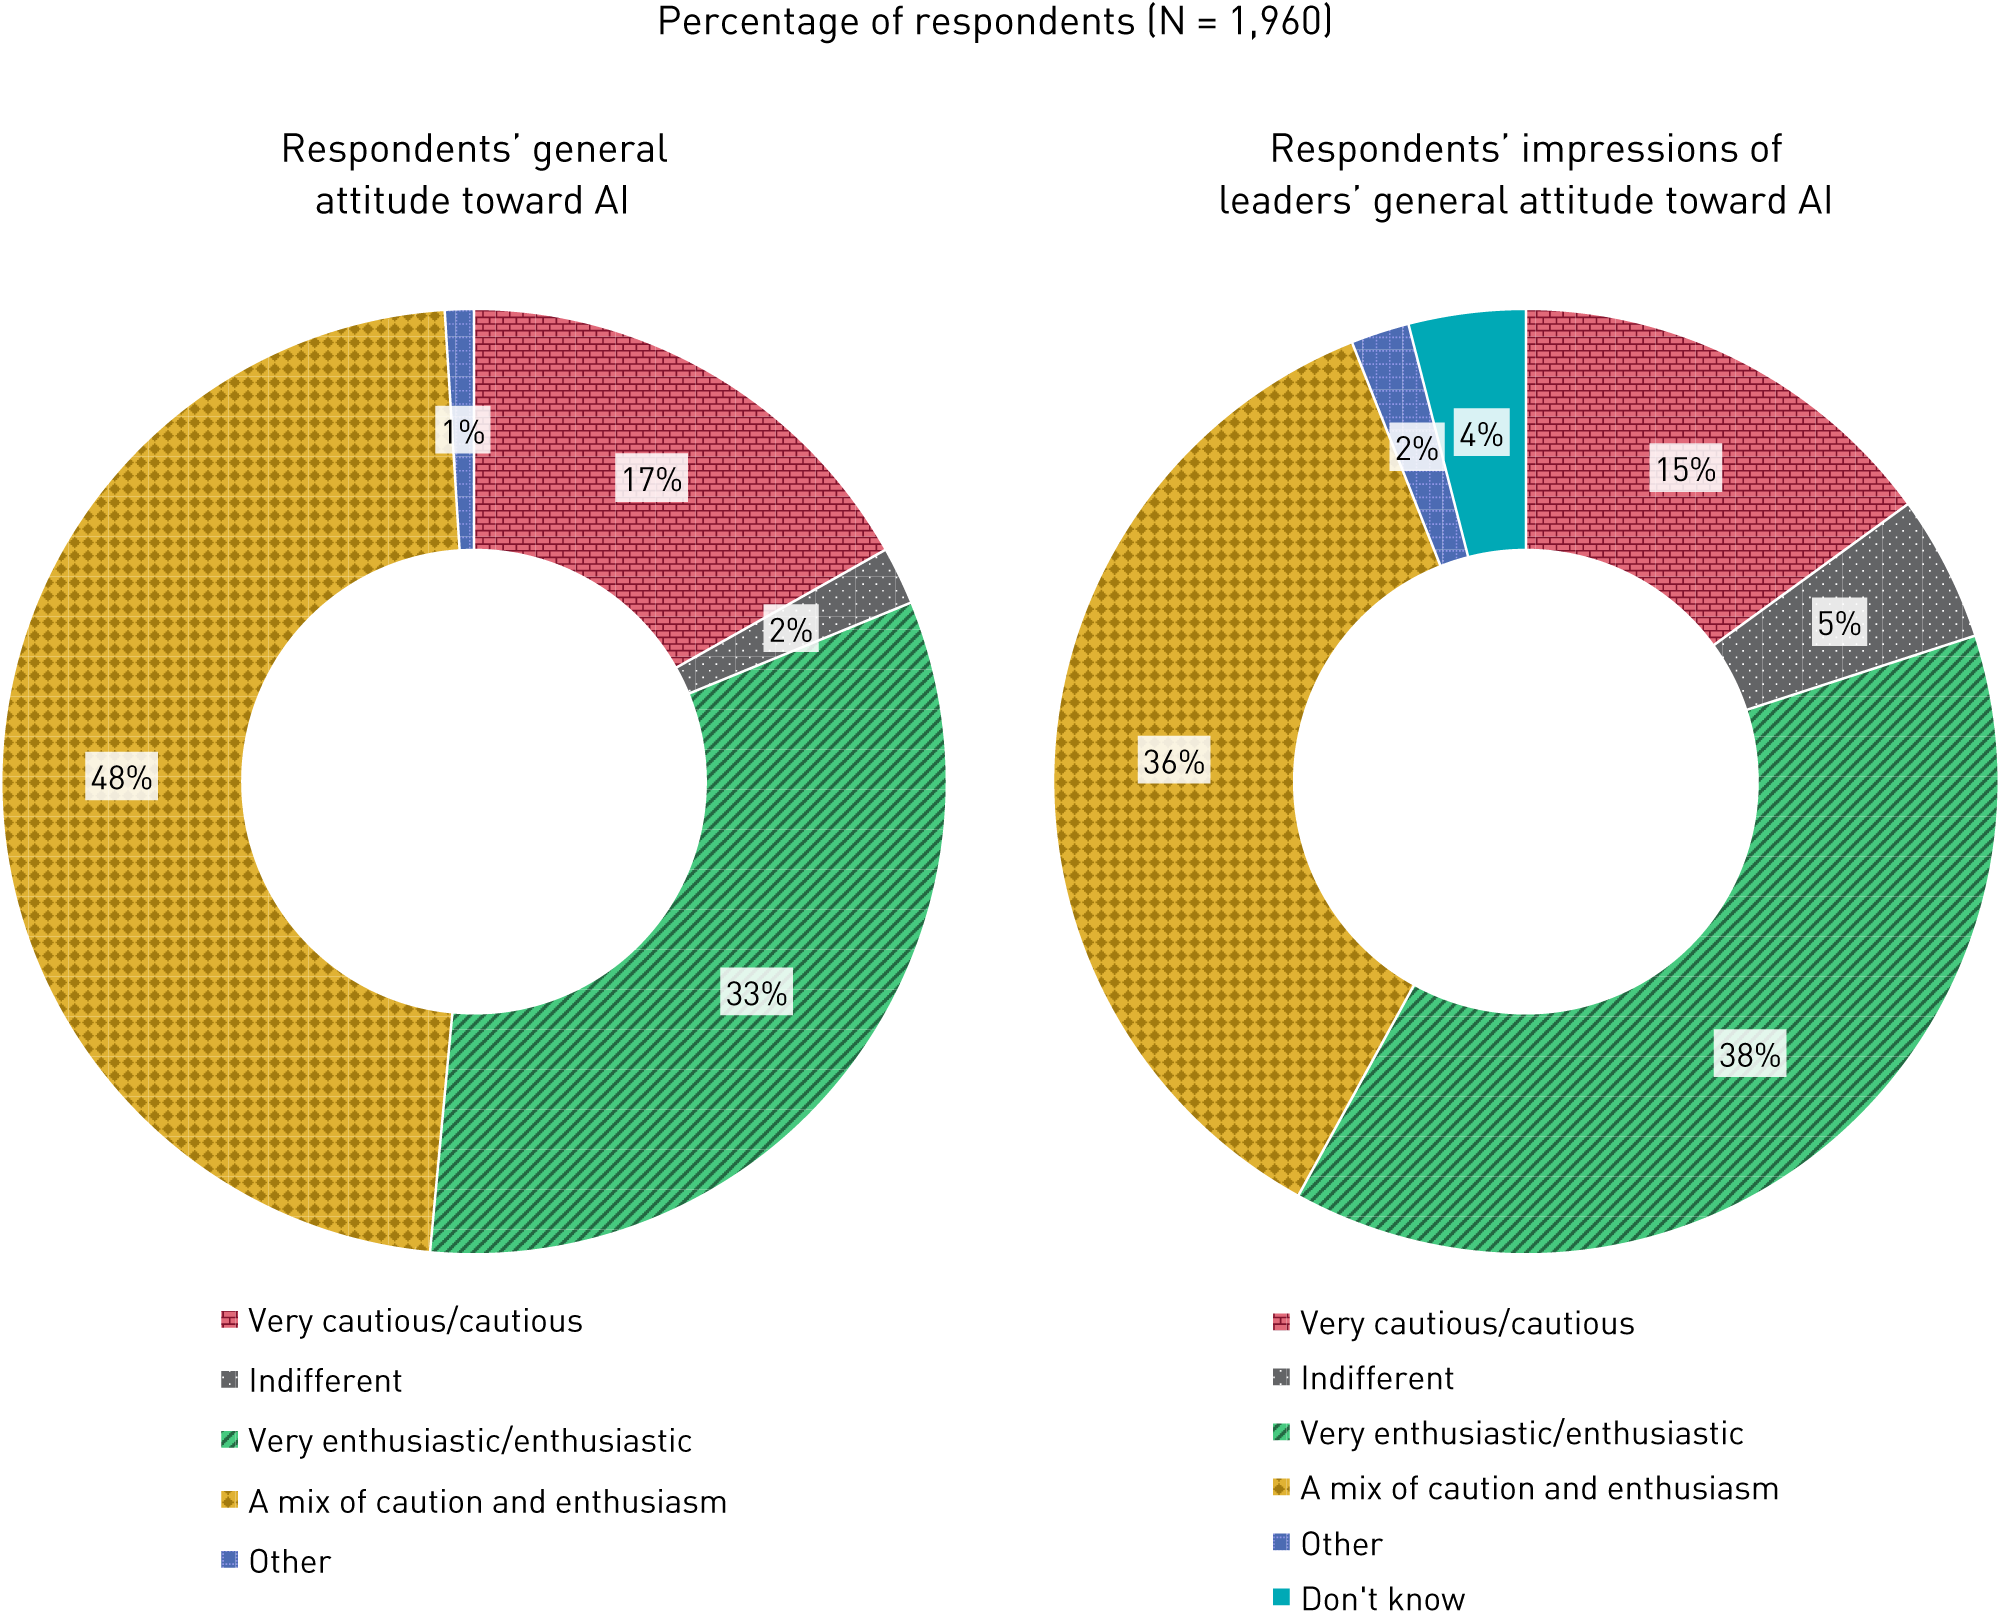
- Most respondents (81%) feel enthusiasm or a mix of caution and enthusiasm toward AI. Just 17% said they feel cautious or very cautious.
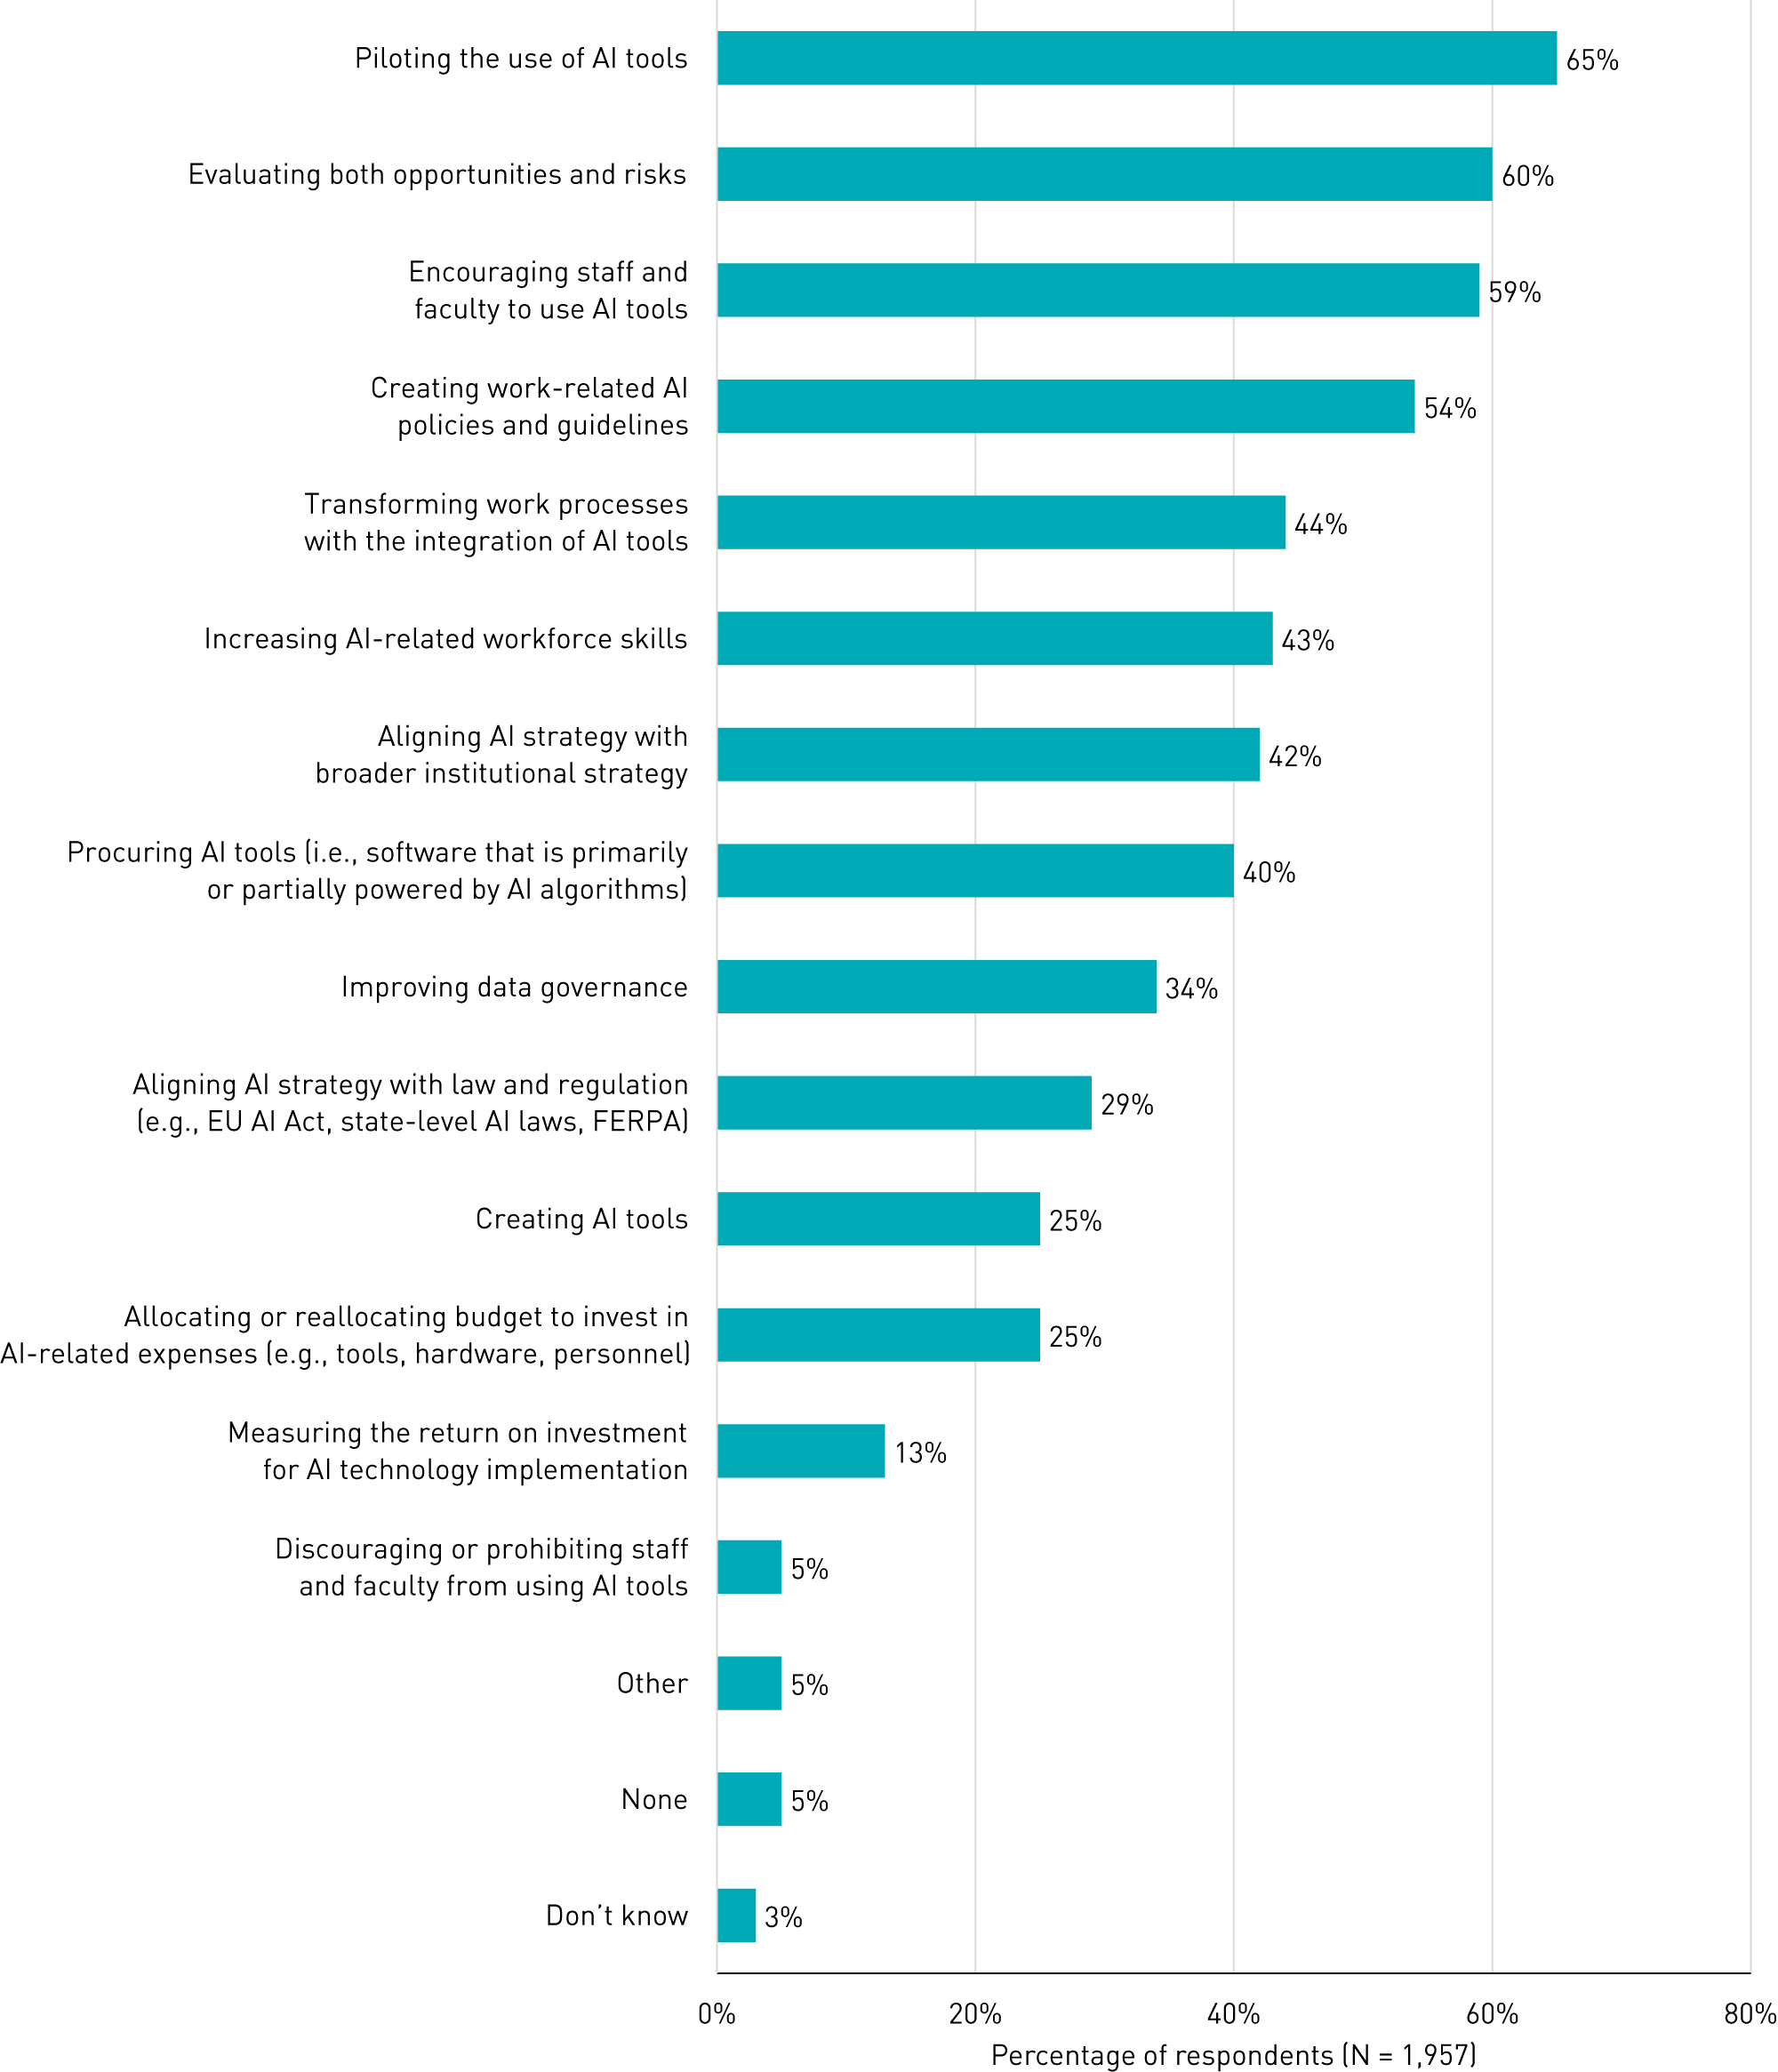
- Most respondents' institutions (92%) have a work-related AI strategy. The most common elements of those strategies are piloting AI tools, evaluating both opportunities and risks, encouraging staff and faculty to use AI tools, and creating policies and guidelines.
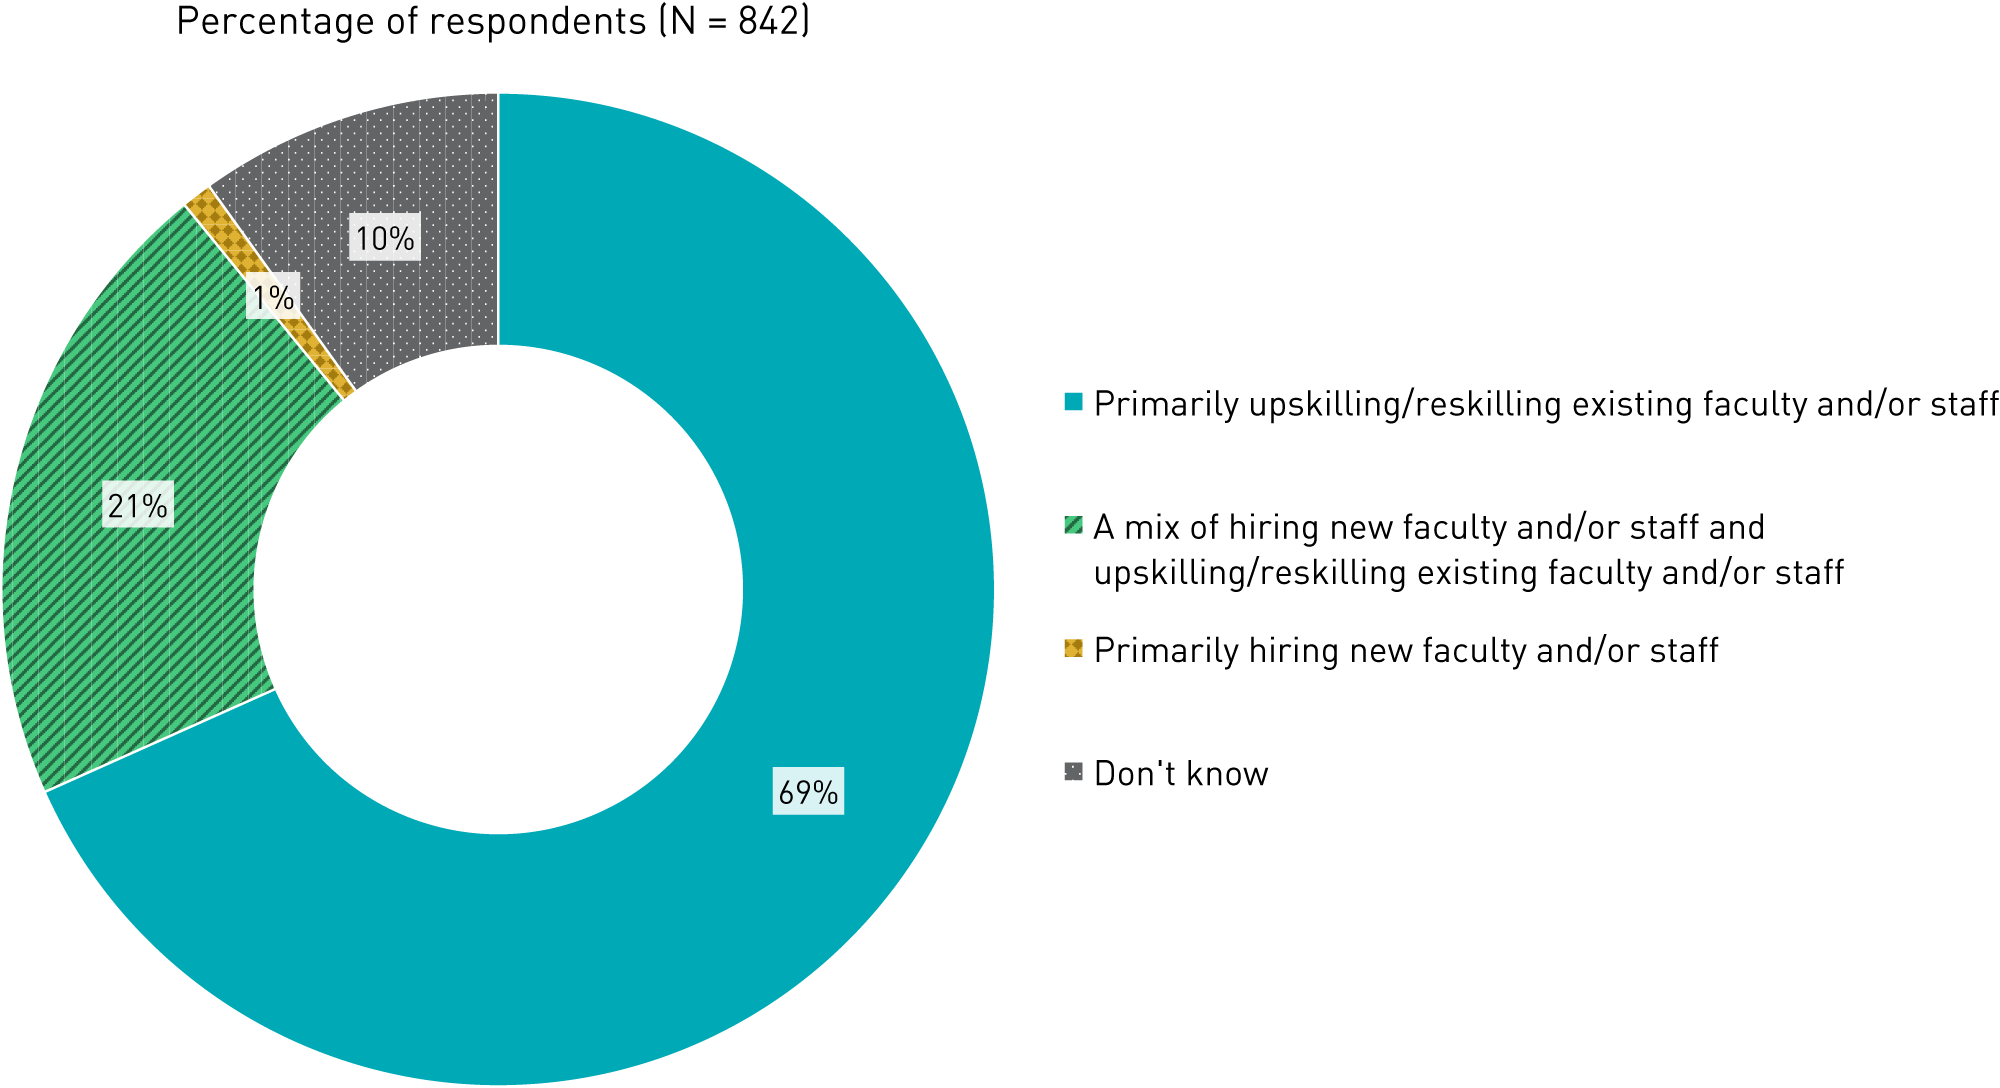
- Among respondents who said their institution's work-related AI strategy includes increasing workforce skills, a majority (69%) said they are doing so primarily by upskilling or reskilling existing staff and faculty.
- Just 13% of respondents said their institution is measuring the return on investment (ROI) for work-related AI tools, pointing to a significant opportunity for institutions to embark on such work.
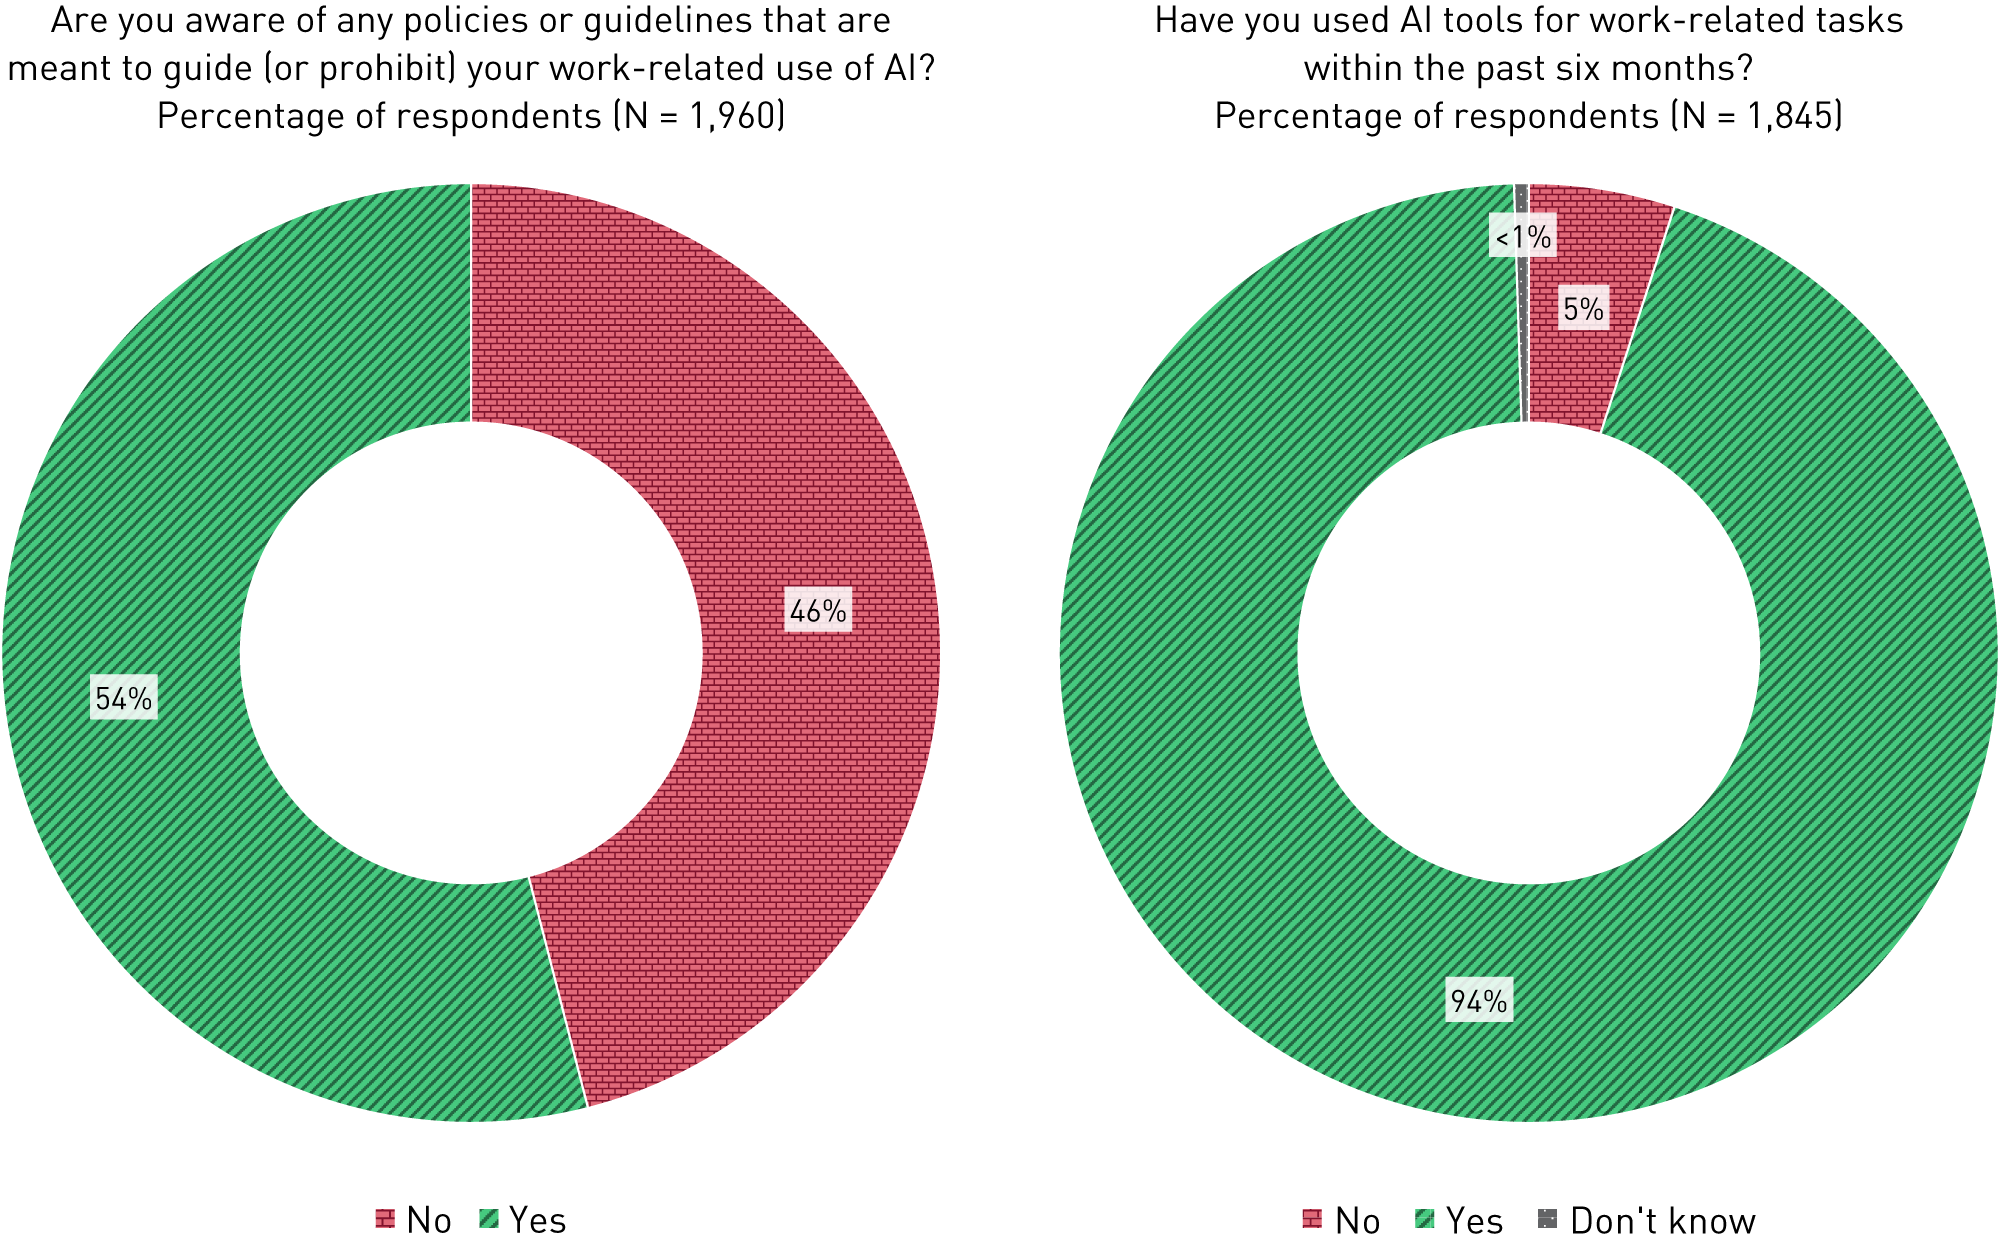
- Though nearly all respondents (94%) said they have used AI tools for work within the past six months, only 54% of respondents said that they are aware of policies and guidelines meant to guide such use. This gap could have serious consequences for data privacy and cybersecurity, data-informed decision making, digital accessibility, and more.
Risks, Opportunities, and Challenges
- More than two-thirds of respondents (67%) identified six or more risks as "urgent," indicating that most respondents are concerned about a breadth of risks associated with using AI. The three most-selected risks are an increase in misinformation, the use of data without consent, and a loss of fundamental skills requiring independent thought.
- Similarly, more than two-thirds of respondents (67%) identified five or more opportunities as "most promising," indicating that most respondents are also optimistic about a range of opportunities for using AI. The three most-selected opportunities are automating repetitive processes, offloading administrative burdens and mundane tasks, and analyzing large datasets.
- The three most-selected challenges associated with using AI tools for work are AI's pace of change, lack of AI expertise, and lack of best practices.
Use Cases
- Among respondents who have recently used AI tools for work-related tasks, a majority (73%) reported that they do so either daily or weekly.
- Among respondents who have not recently used AI tools for work-related tasks, the most common reasons they gave were that they have not wanted to (58%) or have not needed to (50%).
- Just 11% of respondents reported that they are required to use AI tools for work, while 64% reported that not only are they not required to use AI tools for work but they do not expect to be required to do so in the near future
- A majority of all respondents (86%) indicated that they want to use or continue to use AI tools in the future.
- From a list of 30 potential work-related uses of AI tools, more than half of respondents (54%) said they had used AI tools for eight or more types of tasks in the past six months.
- Most respondents have at least some access to AI tools for work through their institution. Just 10% indicated that their institution does not provide access to any of the AI tools they want to use for work.
- More than half of respondents (56%) reported that for work-related tasks, they have used AI tools that are not provided by their institutions. Similar to findings about lack of awareness of policies and guidelines, this insight points to another area of AI-related risk for institutions.
Strategies, Policies, and Guidelines
Institutional Work-Related AI Strategies
Most respondents (81%) feel enthusiasm or a mix of caution and enthusiasm toward AI. A minority of respondents (17%) reported that, in general, they feel cautious or very cautious toward AI. Similarly, just 15% of respondents reported that their institutional leaders appear to feel cautious or very cautious about AI (see figure 1). These findings align with findings from EDUCAUSE research into the AI landscape in 2024 and 2025, in which roughly one in five respondents indicated that their institutional leaders feel cautious or very cautious about AI (23% in 2024 and 20% in 2025). Taken together, these data suggest that higher education professionals might be shifting away from pure caution toward AI, though sampling differences in these studies make it difficult to make direct comparisons.
Work-related AI strategies are nearly ubiquitous, and they generally don't prohibit AI use. A mere 5% of respondents said that their institution has no work-related AI strategy. A majority of respondents (64%) selected five or more elements—from a closed-ended list provided in the survey—that are included in their institution's work-related AI strategy, indicating that institutions are likely taking a multipronged approach. The most frequently selected elements of such strategies were piloting the use of AI tools (65%), evaluating both opportunities and risks (60%), encouraging staff and faculty to use AI tools (59%), and creating work-related policies and guidelines (54%, see figure 2). Just 5% of respondents reported that their institution is discouraging or prohibiting the use of AI tools for work. Notably, when responses are disaggregated by role, the perspectives of executive leaders aligned with these overall findings.
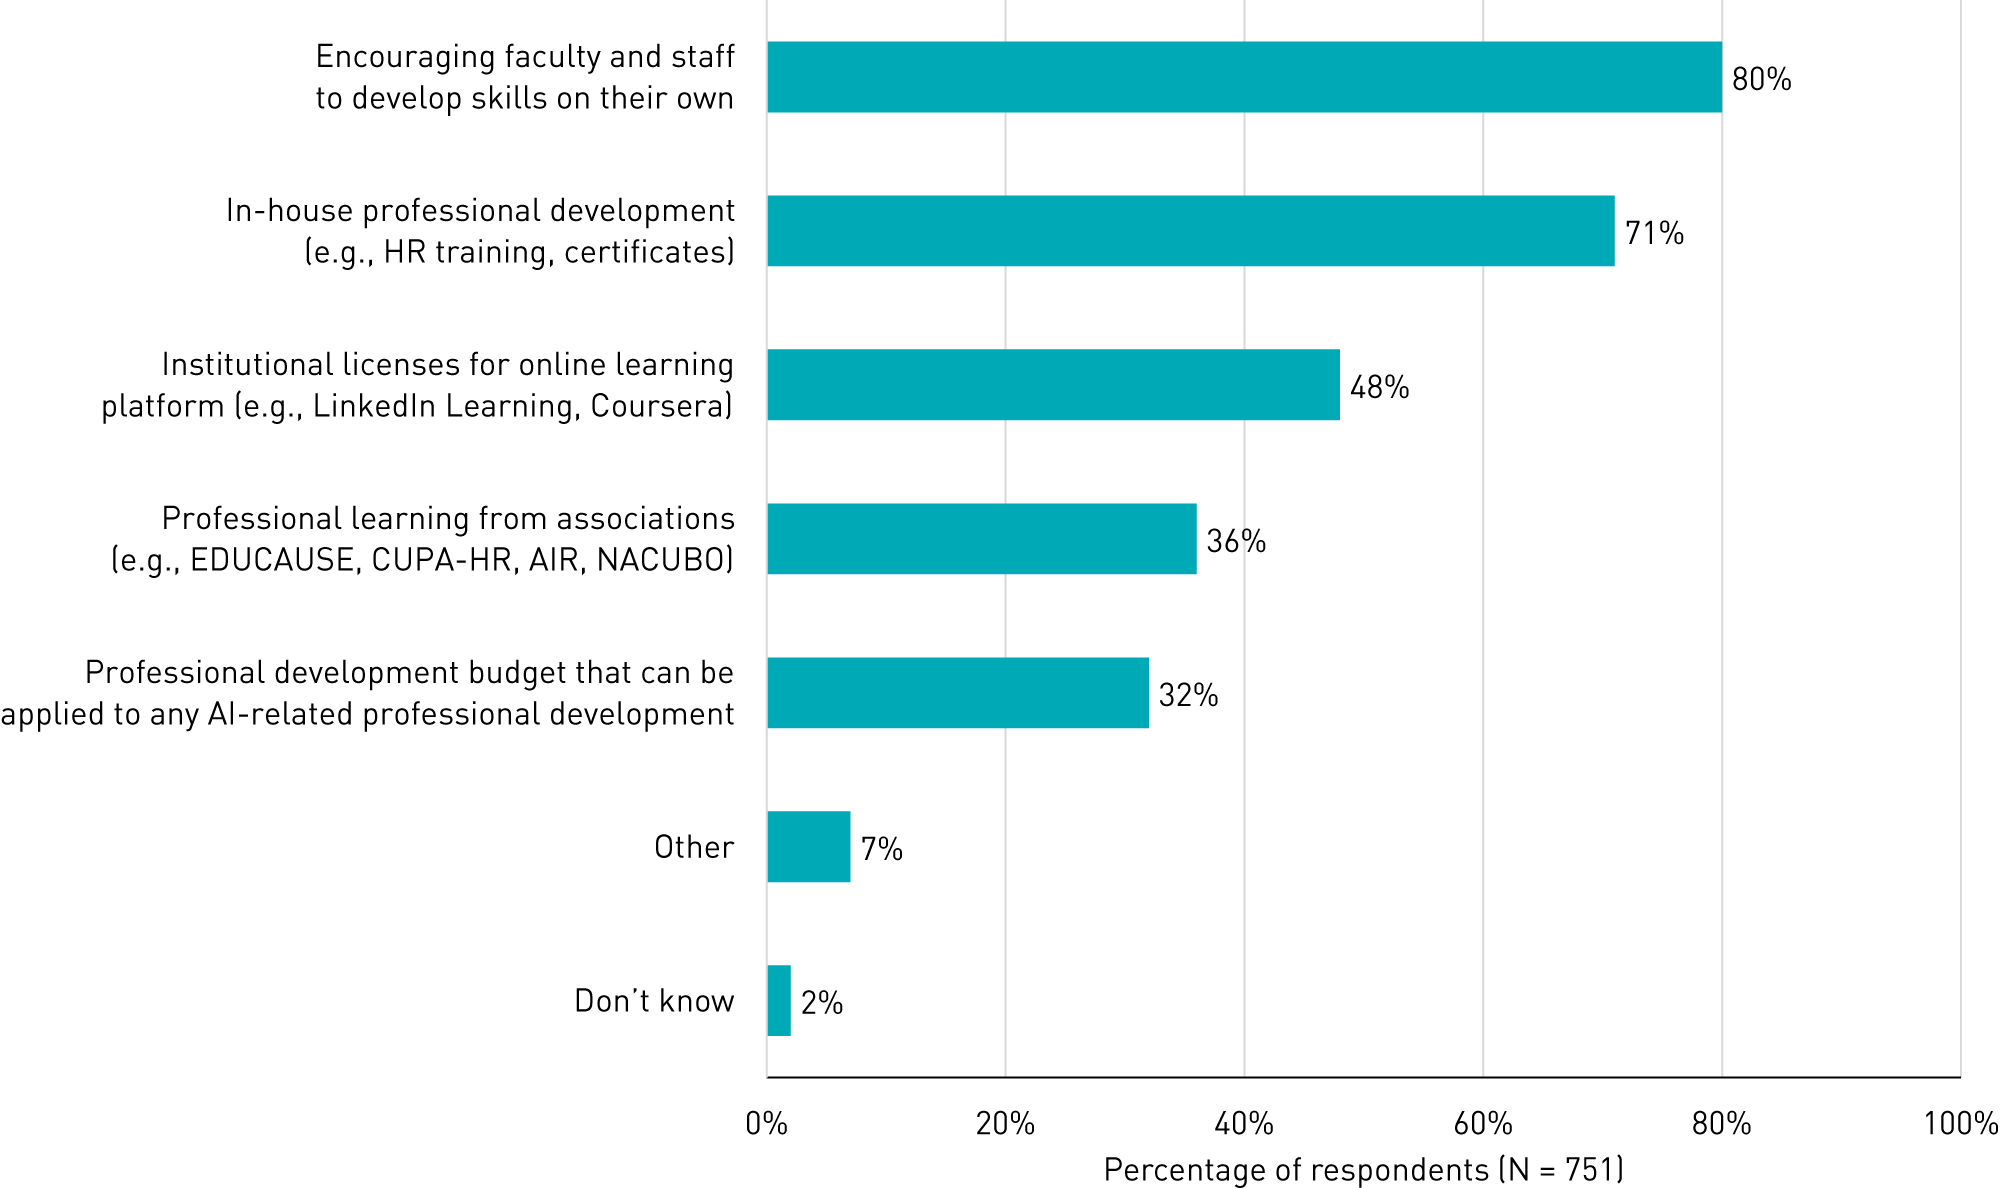
Institutions continue to upskill existing staff and faculty. Among respondents who indicated that their institution's work-related AI strategy includes increasing AI-related workforce skills, a majority (69%) said they were doing so primarily by upskilling and reskilling existing faculty and staff (see figure 3). This aligns with the findings of the 2025 EDUCAUSE AI landscape study, in which a plurality of all respondents (37%) indicated that their institutions were upskilling and reskilling existing faculty and staff. Together, these findings suggest that institutions continue to focus on increasing skills of the existing workforce rather than hiring new roles. When asked how their institutions are upskilling and reskilling existing staff and faculty, most respondents reported that their institution is encouraging faculty and staff to develop skills on their own (80%) or offering them in-house professional learning opportunities such as HR training or certificates (71%, see figure 4). In other EDUCAUSE research, experts have emphasized the importance of self-exploration of AI tools, but the value of structured learning opportunities should not be overlooked.
Measuring return on investment (ROI) is nascent. The small percentage of respondents who indicated that their institution is measuring the ROI for AI technology implementation (13%, see figure 2) were asked an additional open-ended question about how they were doing so. Most said that they are not sure. Other respondents described user experience surveys, focus groups, and empirical observation of KPIs such as adoption rates and usage time, user satisfaction, and work time for specific tasks pre- and post-implementation. Respondents also explained that measuring the ROI of AI tools as an isolated element is often challenging or perhaps even impossible: "AI alone can't really create the business outcome value that's needed to justify the investment, and supporting actions such as data quality and data integration and business process rehabilitation…[is] required if we're going to get more than a few percentage points of improvement." Further, respondents expressed concerns throughout the survey that enthusiasm for AI tools is outweighing a strategic approach to measuring ROI. For example, one respondent explained, "I am still waiting for a use case that exceeds what we have already or reduces our costs." As we reported in a recent case study, "Establishing ROI for Evaluating Edtech Tools," these challenges related to measuring the ROI of technology solutions are not unique to AI tools. In this way, evaluating ROI is a major area of opportunity for higher education leaders.
Work-Related AI Policies and Guidelines
Work-related AI policies and guides are lagging behind AI adoption. Respondents were nearly evenly split when asked whether they are aware of any policies or guidelines meant to guide their work-related use of AI tools. This is a particularly concerning finding given that nearly all respondents (94%) reported that they have used AI tools for work within the past six months (see figure 5).
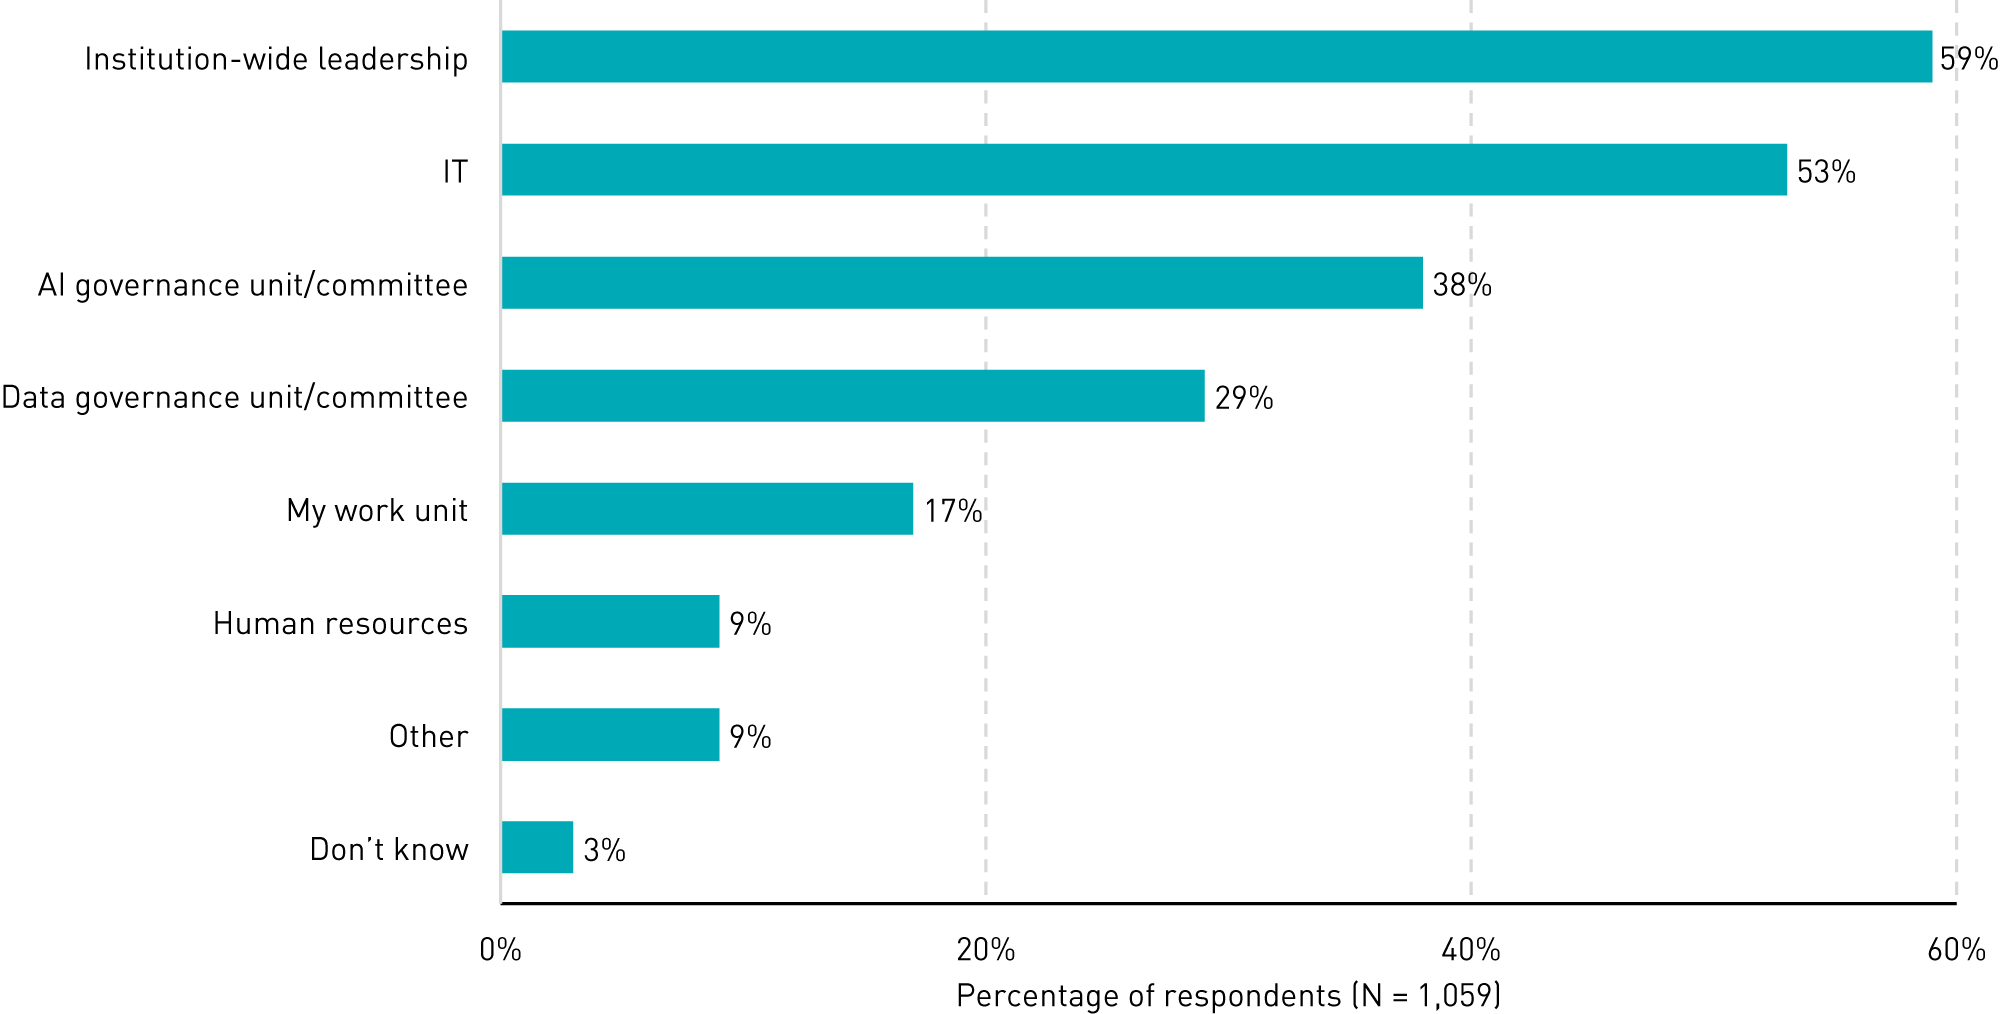
With 46% of respondents reporting that they are not aware of policies or guidelines meant to guide their work-related use of AI tools, one might ask whether this finding is the result of employees lacking awareness about policies/guidelines or whether relevant policies/guidelines don't exist on their campus. Disaggregating the data by respondents' primary positions and areas of expertise provides some answers. For example, 38% of executive leaders and 43% of managers and directors reported that they are not aware of policies/guidelines meant to guide work-related use of AI. Similarly, 35% of technology professionals and 30% of cybersecurity and privacy professionals reported that they are not aware of such policies/guidelines. Given that institutional leaders and IT professionals are the two groups of stakeholders most likely to have decision-making authority for work-related AI policies/guidelines (see figure 6), these data suggest that many institutions simply do not have such policies/guidelines, rather than indicating insufficient communication about policies.
Further, among respondents who said they have not used AI tools for work-related tasks in the past six months, only 15 said this was due to uncertainty about institutional or unit-level policies and guidelines. This underscores the finding that a lack of policies and guidelines (or a lack of awareness of them) does not deter staff and faculty from using AI tools for work. For these reasons, institutions should view the creation and socialization of work-related AI policies and guidelines as an urgent issue due to the risks associated with improper AI tools use (see figure 9 for a list of the most urgent risks associated with using AI tools for work).
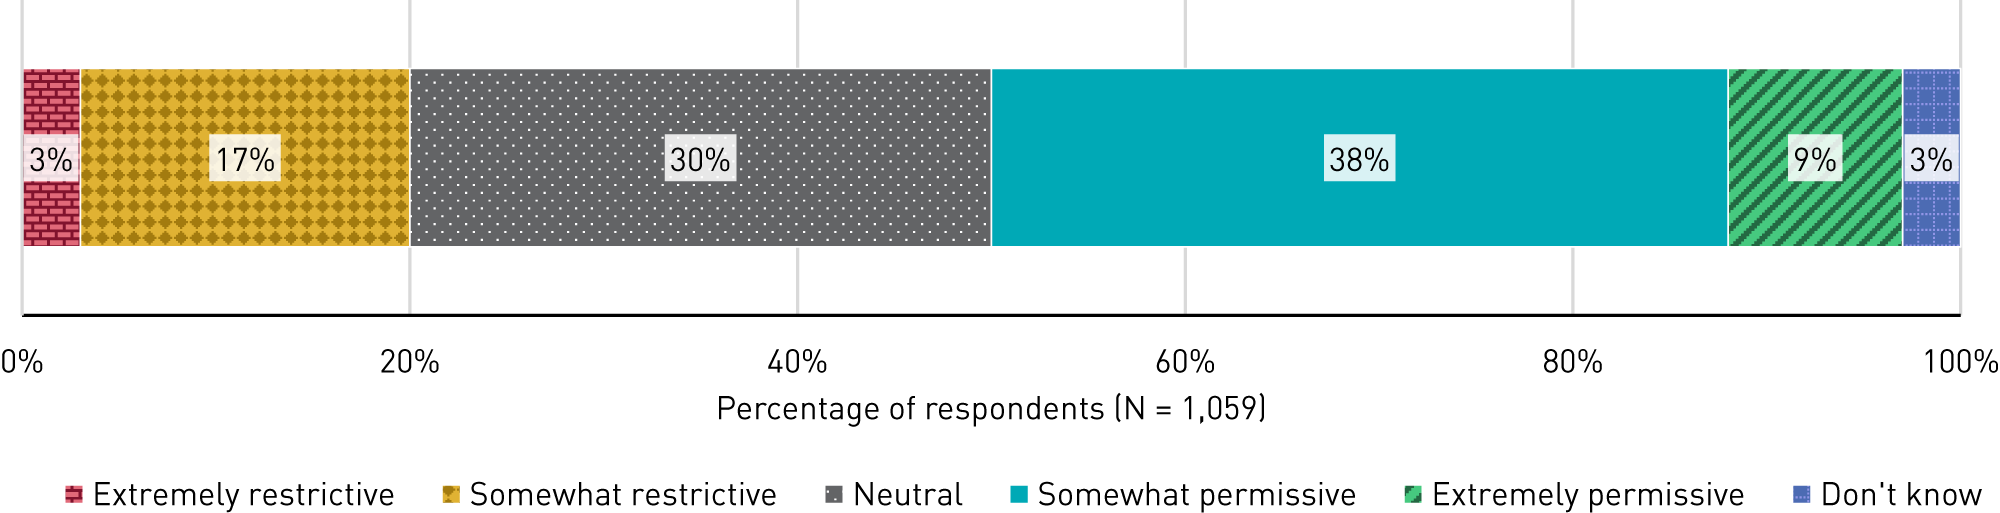
When institutions do have AI-related policies and guidelines, they are usually permissive or neutral. Among respondents who said that their institution has work-related AI policies and guidelines, nearly half (47%) characterized them as somewhat or extremely permissive, and nearly a third (30%) characterize them as neutral (see figure 7). This finding aligns with the 2024 EDUCAUSE AI Landscape study, in which we reported that a plurality of respondents (41%) found their institution's general AI-related policies to be somewhat or extremely permissive, 32% found them to be neutral, and 18% found them to be somewhat or extremely restrictive. Together, these findings suggest that institutions are avoiding restrictive policies and guidelines, possibly in an effort to balance caution with innovation.
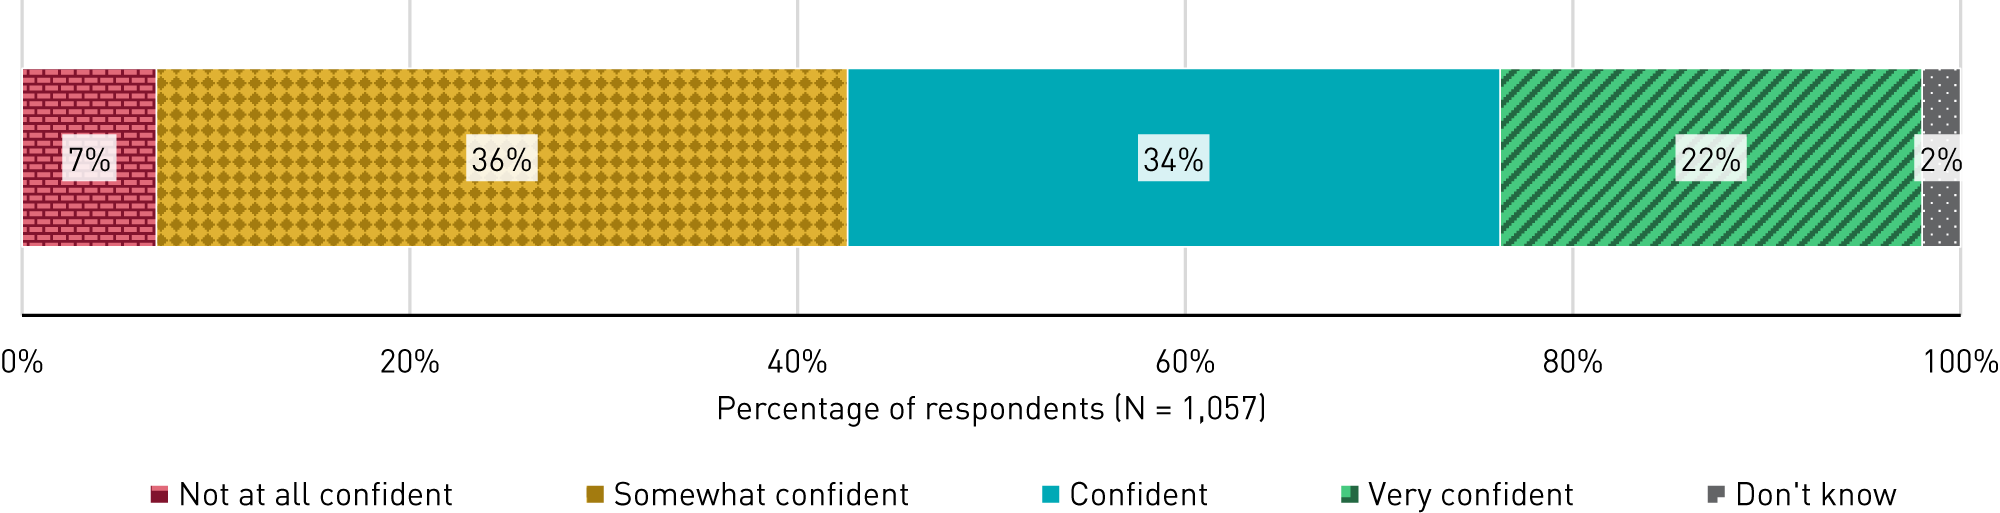
However, the efficacy of existing work-related AI policies and guidelines remains unclear. Only about half of respondents said that, with the policies and guidelines their institution or unit currently has in place, they feel confident (34%) or very confident (22%) using AI tools for work (see figure 8). This finding reveals an opportunity for institutional leaders to improve communication with staff and faculty about existing policies and guidelines.
Risks, Opportunities, and Challenges
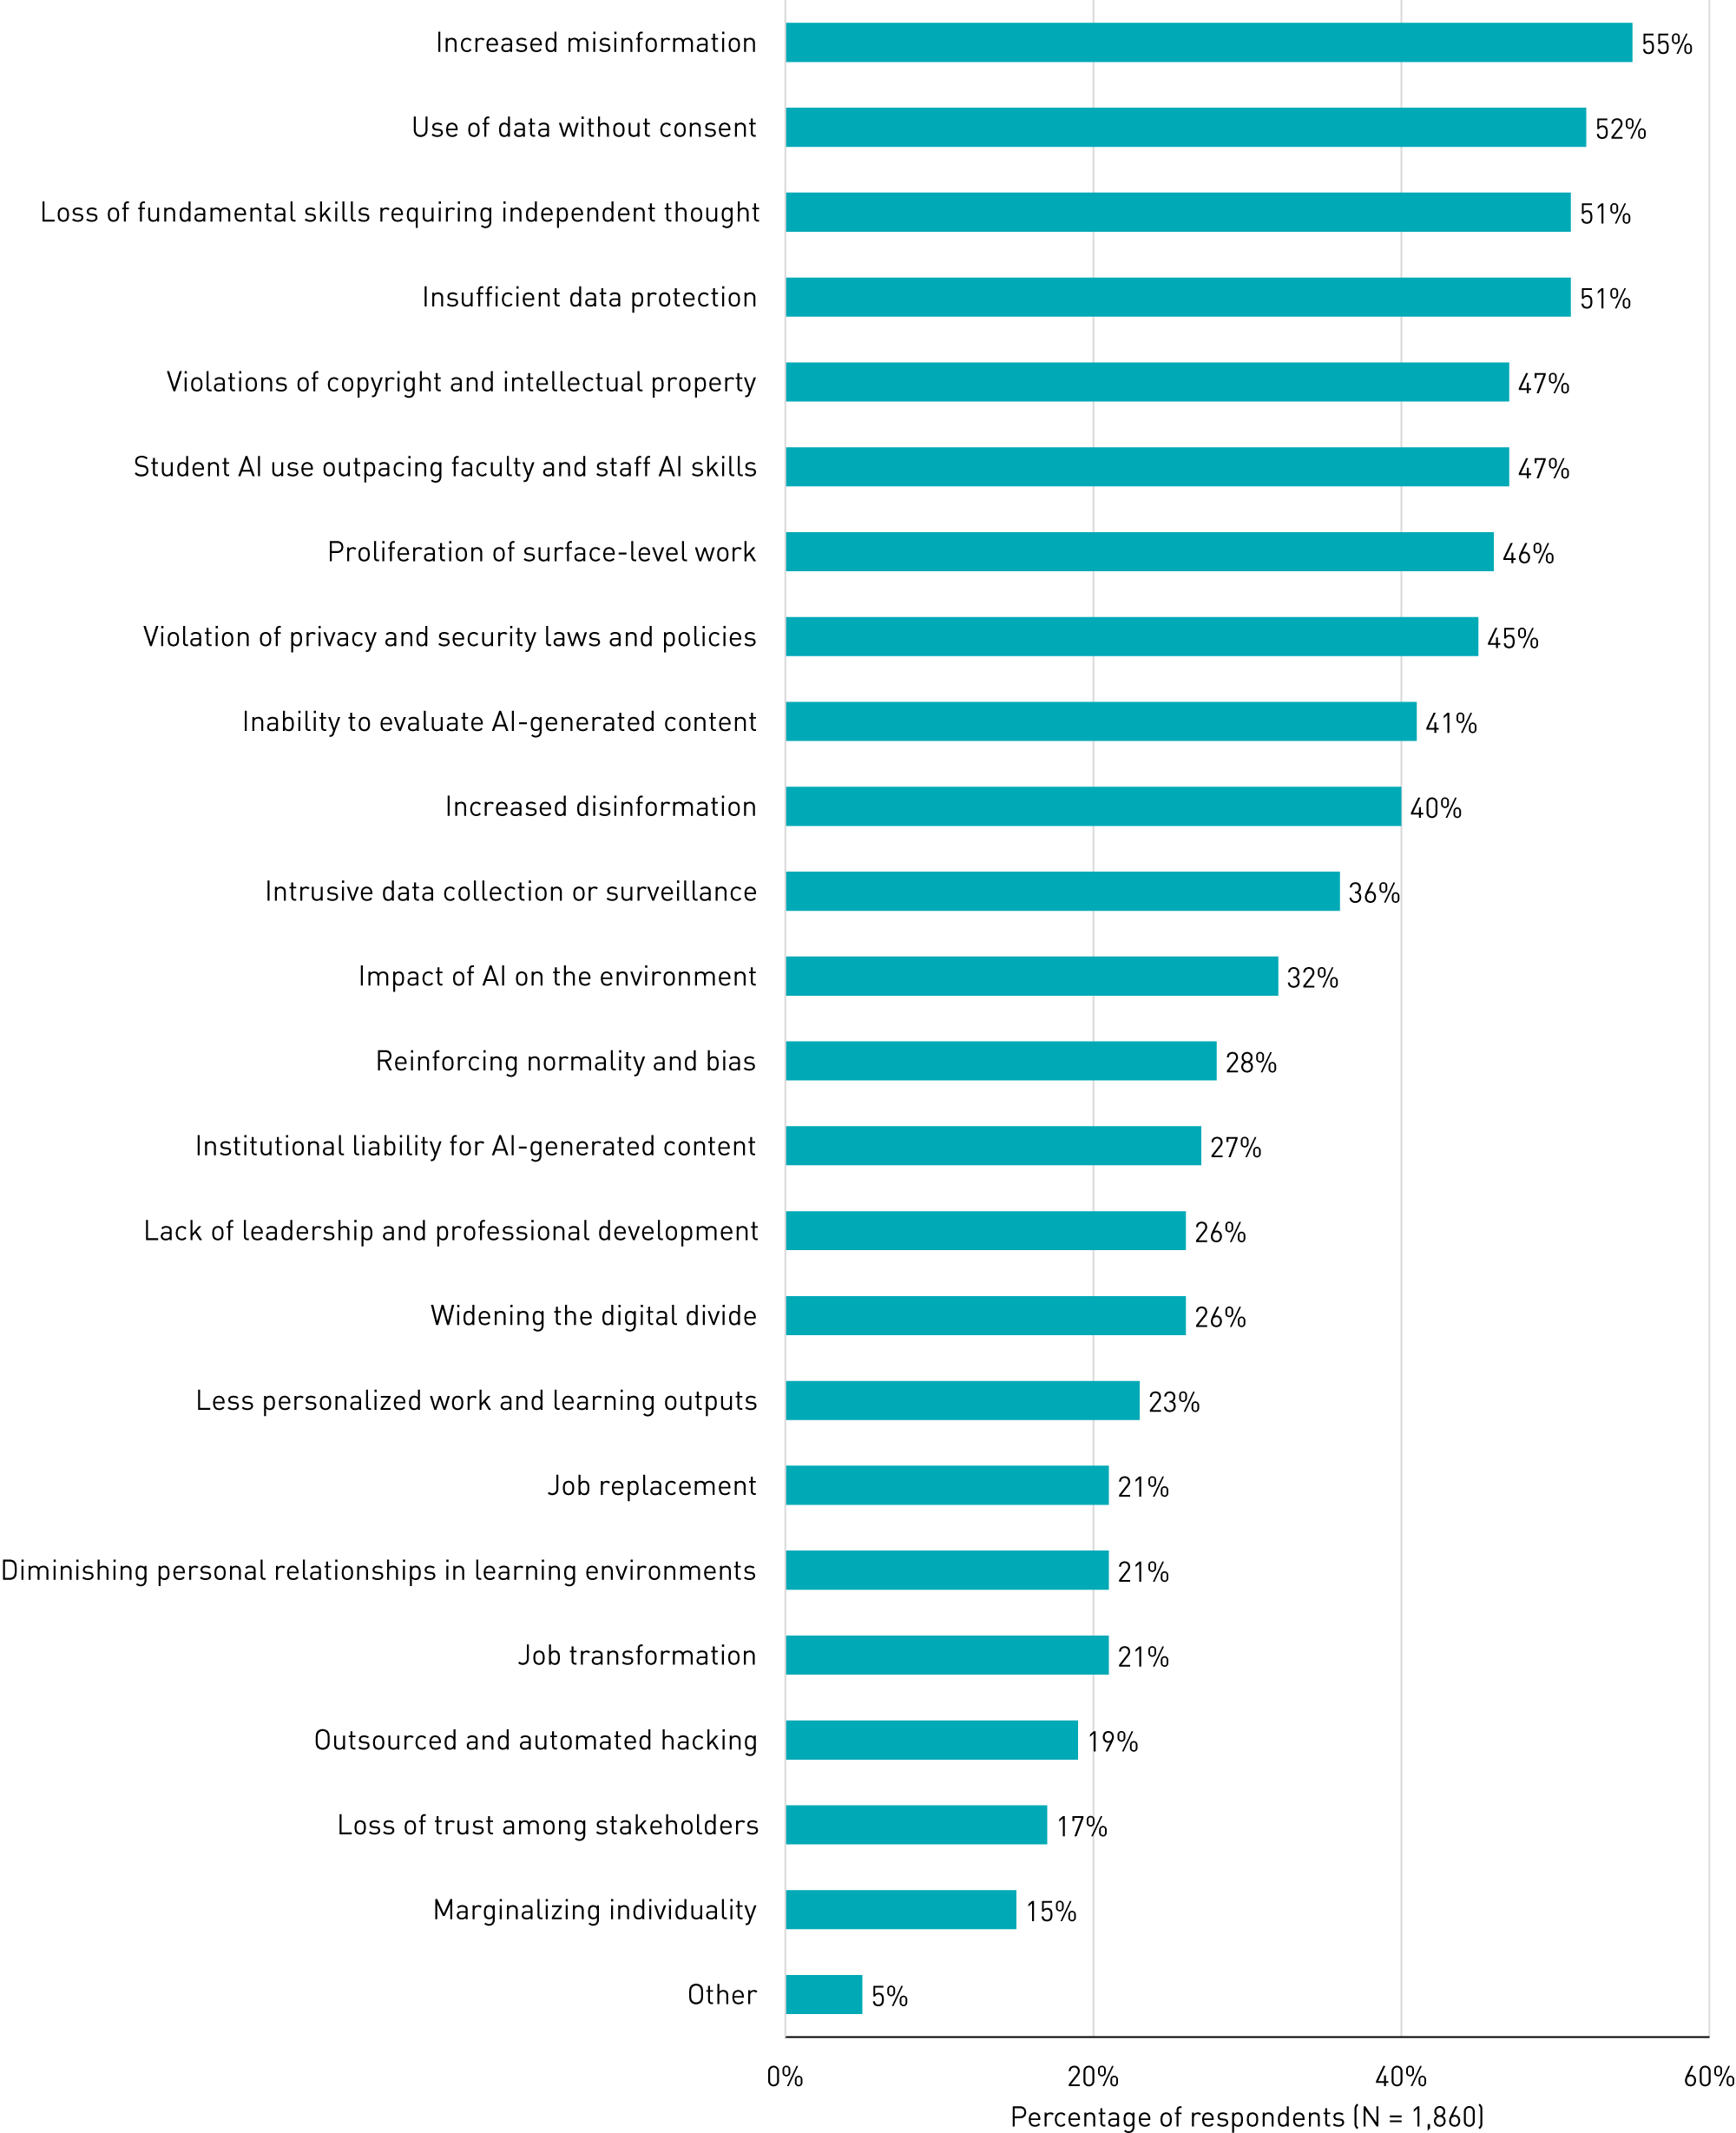
Higher education staff and faculty continue to feel concern about many risks and optimism about many opportunities. When asked to identify the most urgent risks associated with using AI tools for work in higher education, a majority (67%) selected six or more items from the closed-ended list shown in figure 9, indicating that most respondents are concerned about a breadth of risks associated with using AI.1 The most-selected risks were increased misinformation (55%), use of data without consent (52%), loss of fundamental skills requiring independent thought (51%), and insufficient data protection (51%).
Respondents described other risks in open-ended comments:
- Concentration of wealth and power within a few technology companies
- Academic misconduct
- Inconsistent policies for staff, faculty, and students
- Loss of creativity and innovation
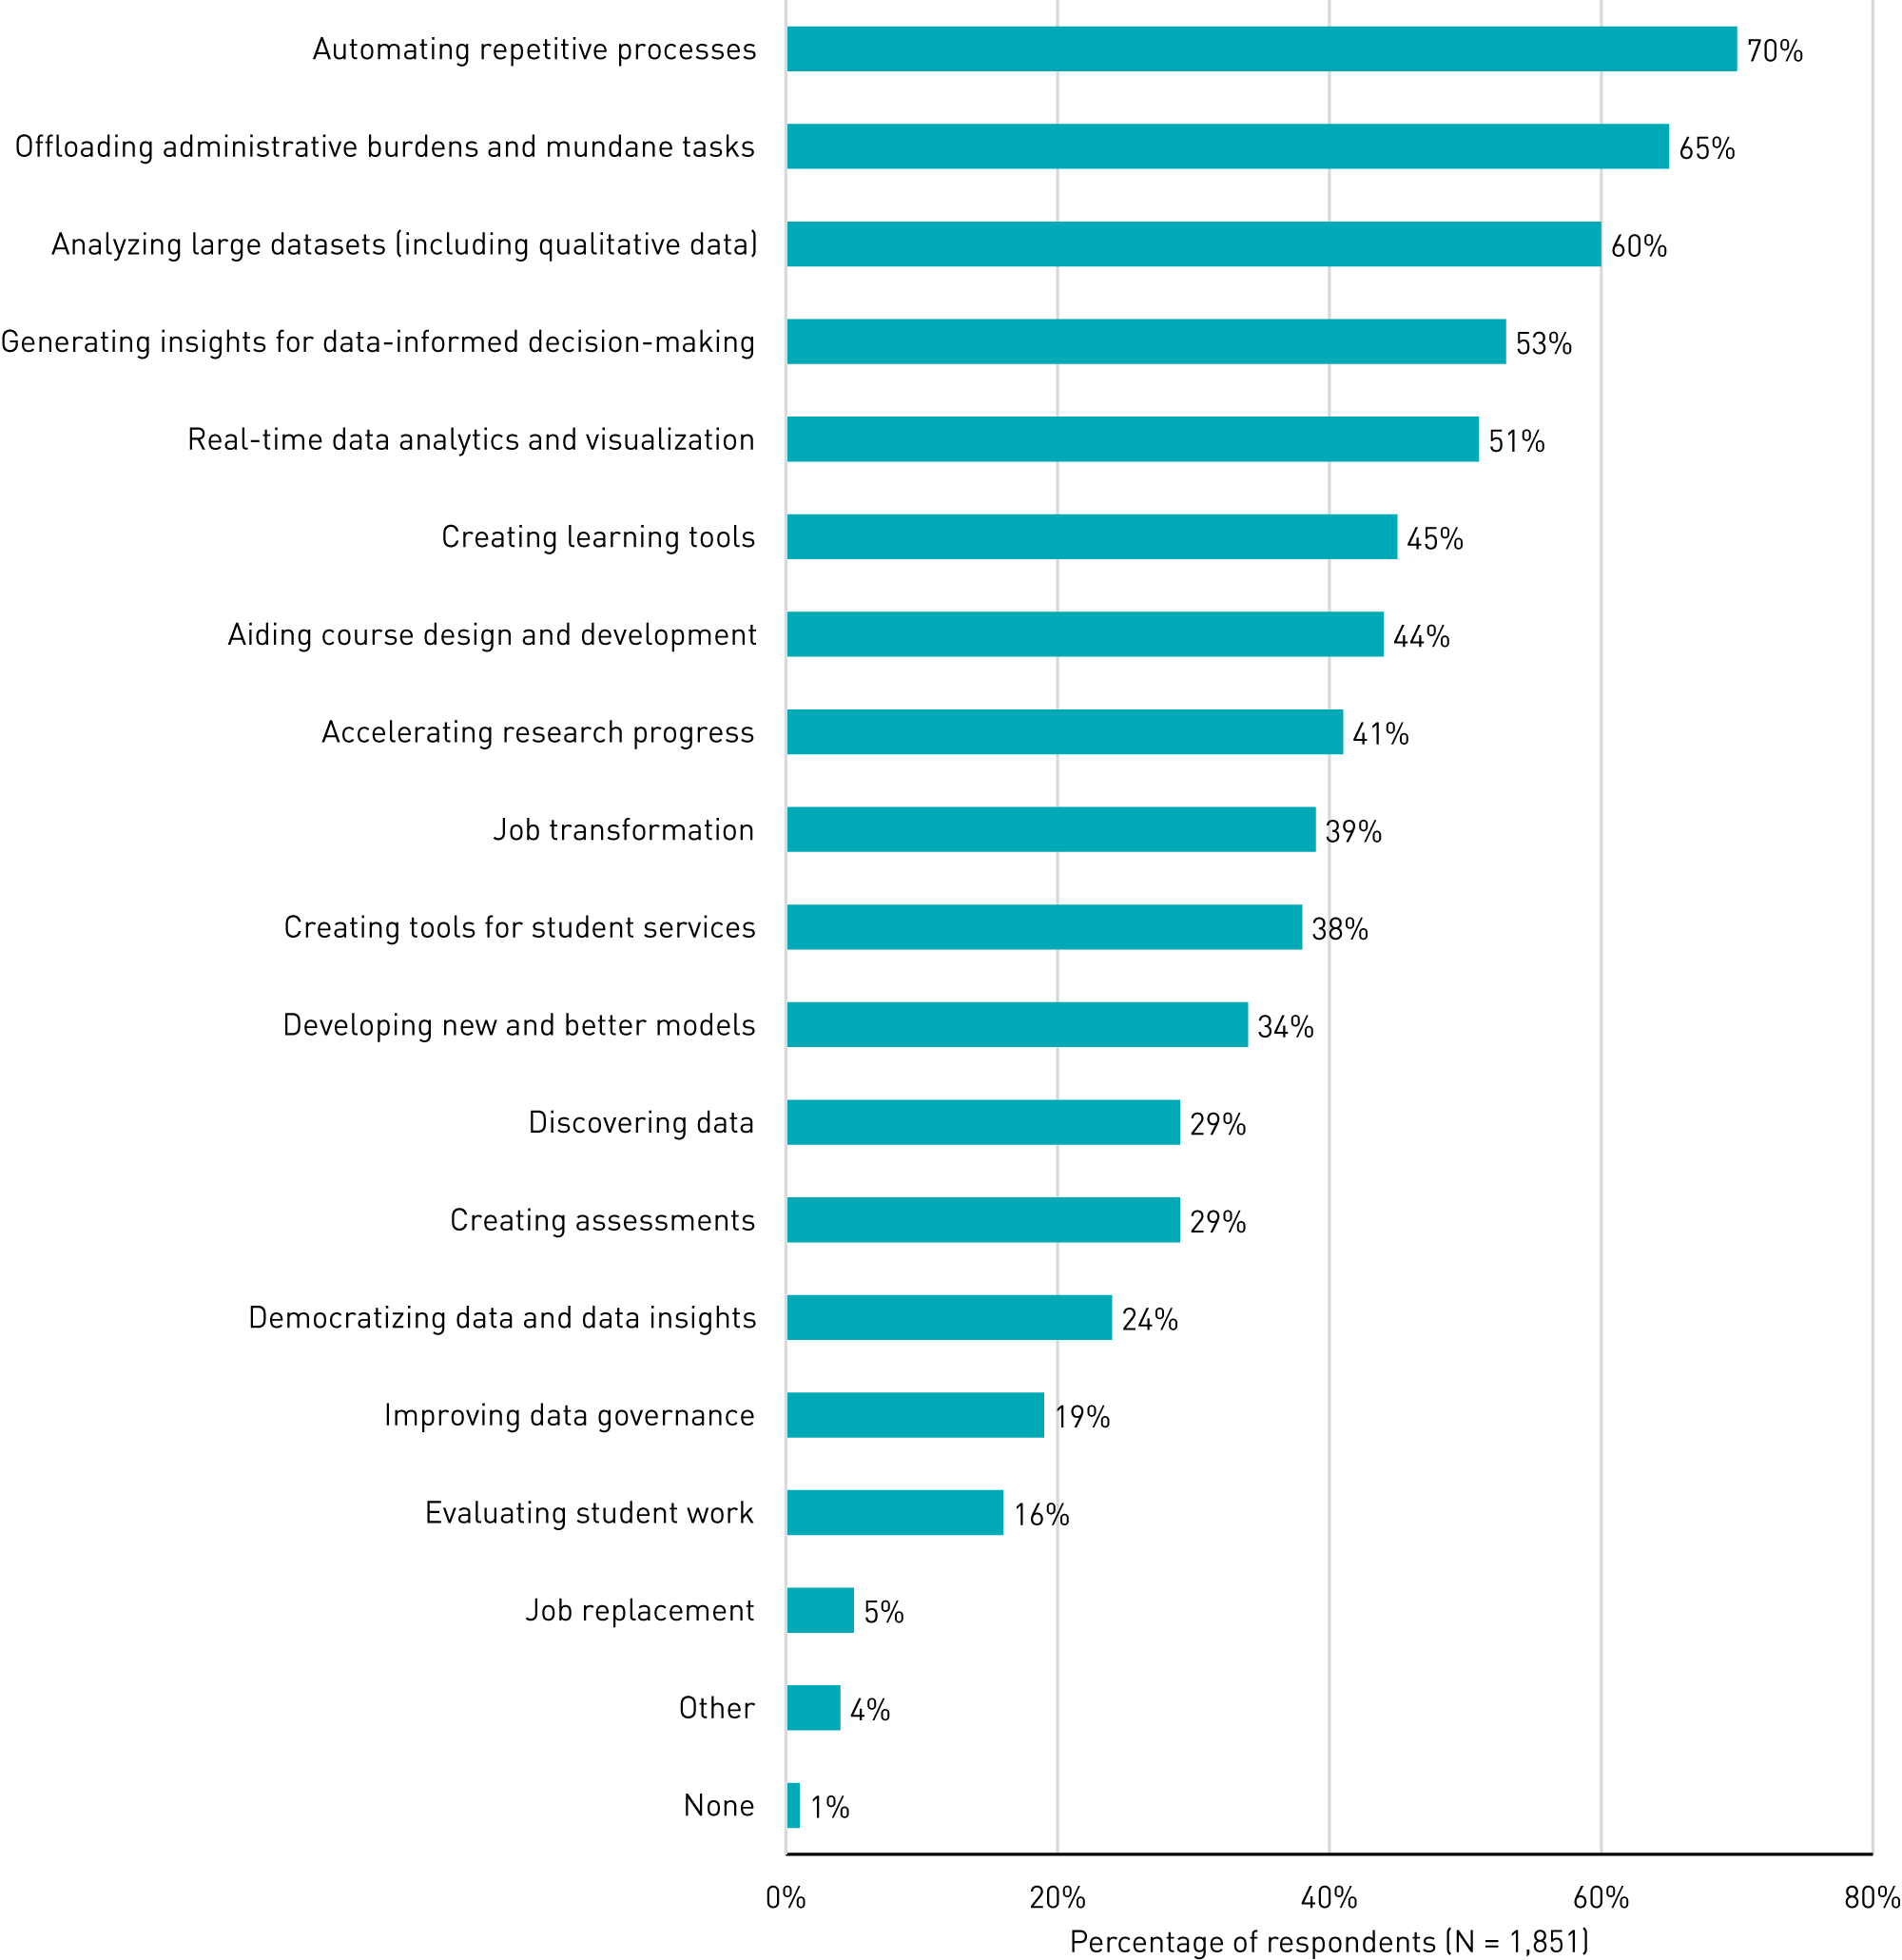
Similarly, when asked about promising opportunities, a majority (67%) selected five or more items from the list shown in figure 10, indicating that most respondents are also optimistic about a range of opportunities for using AI. The most-selected opportunities are automating repetitive processes (70%), offloading administrative burdens and mundane tasks (65%), and analyzing large datasets (60%).
Respondents described other opportunities in open-ended comments:
- Personalized learning assistants
- Customer service agents
- Improving digital accessibility
- Motivating educators to innovate
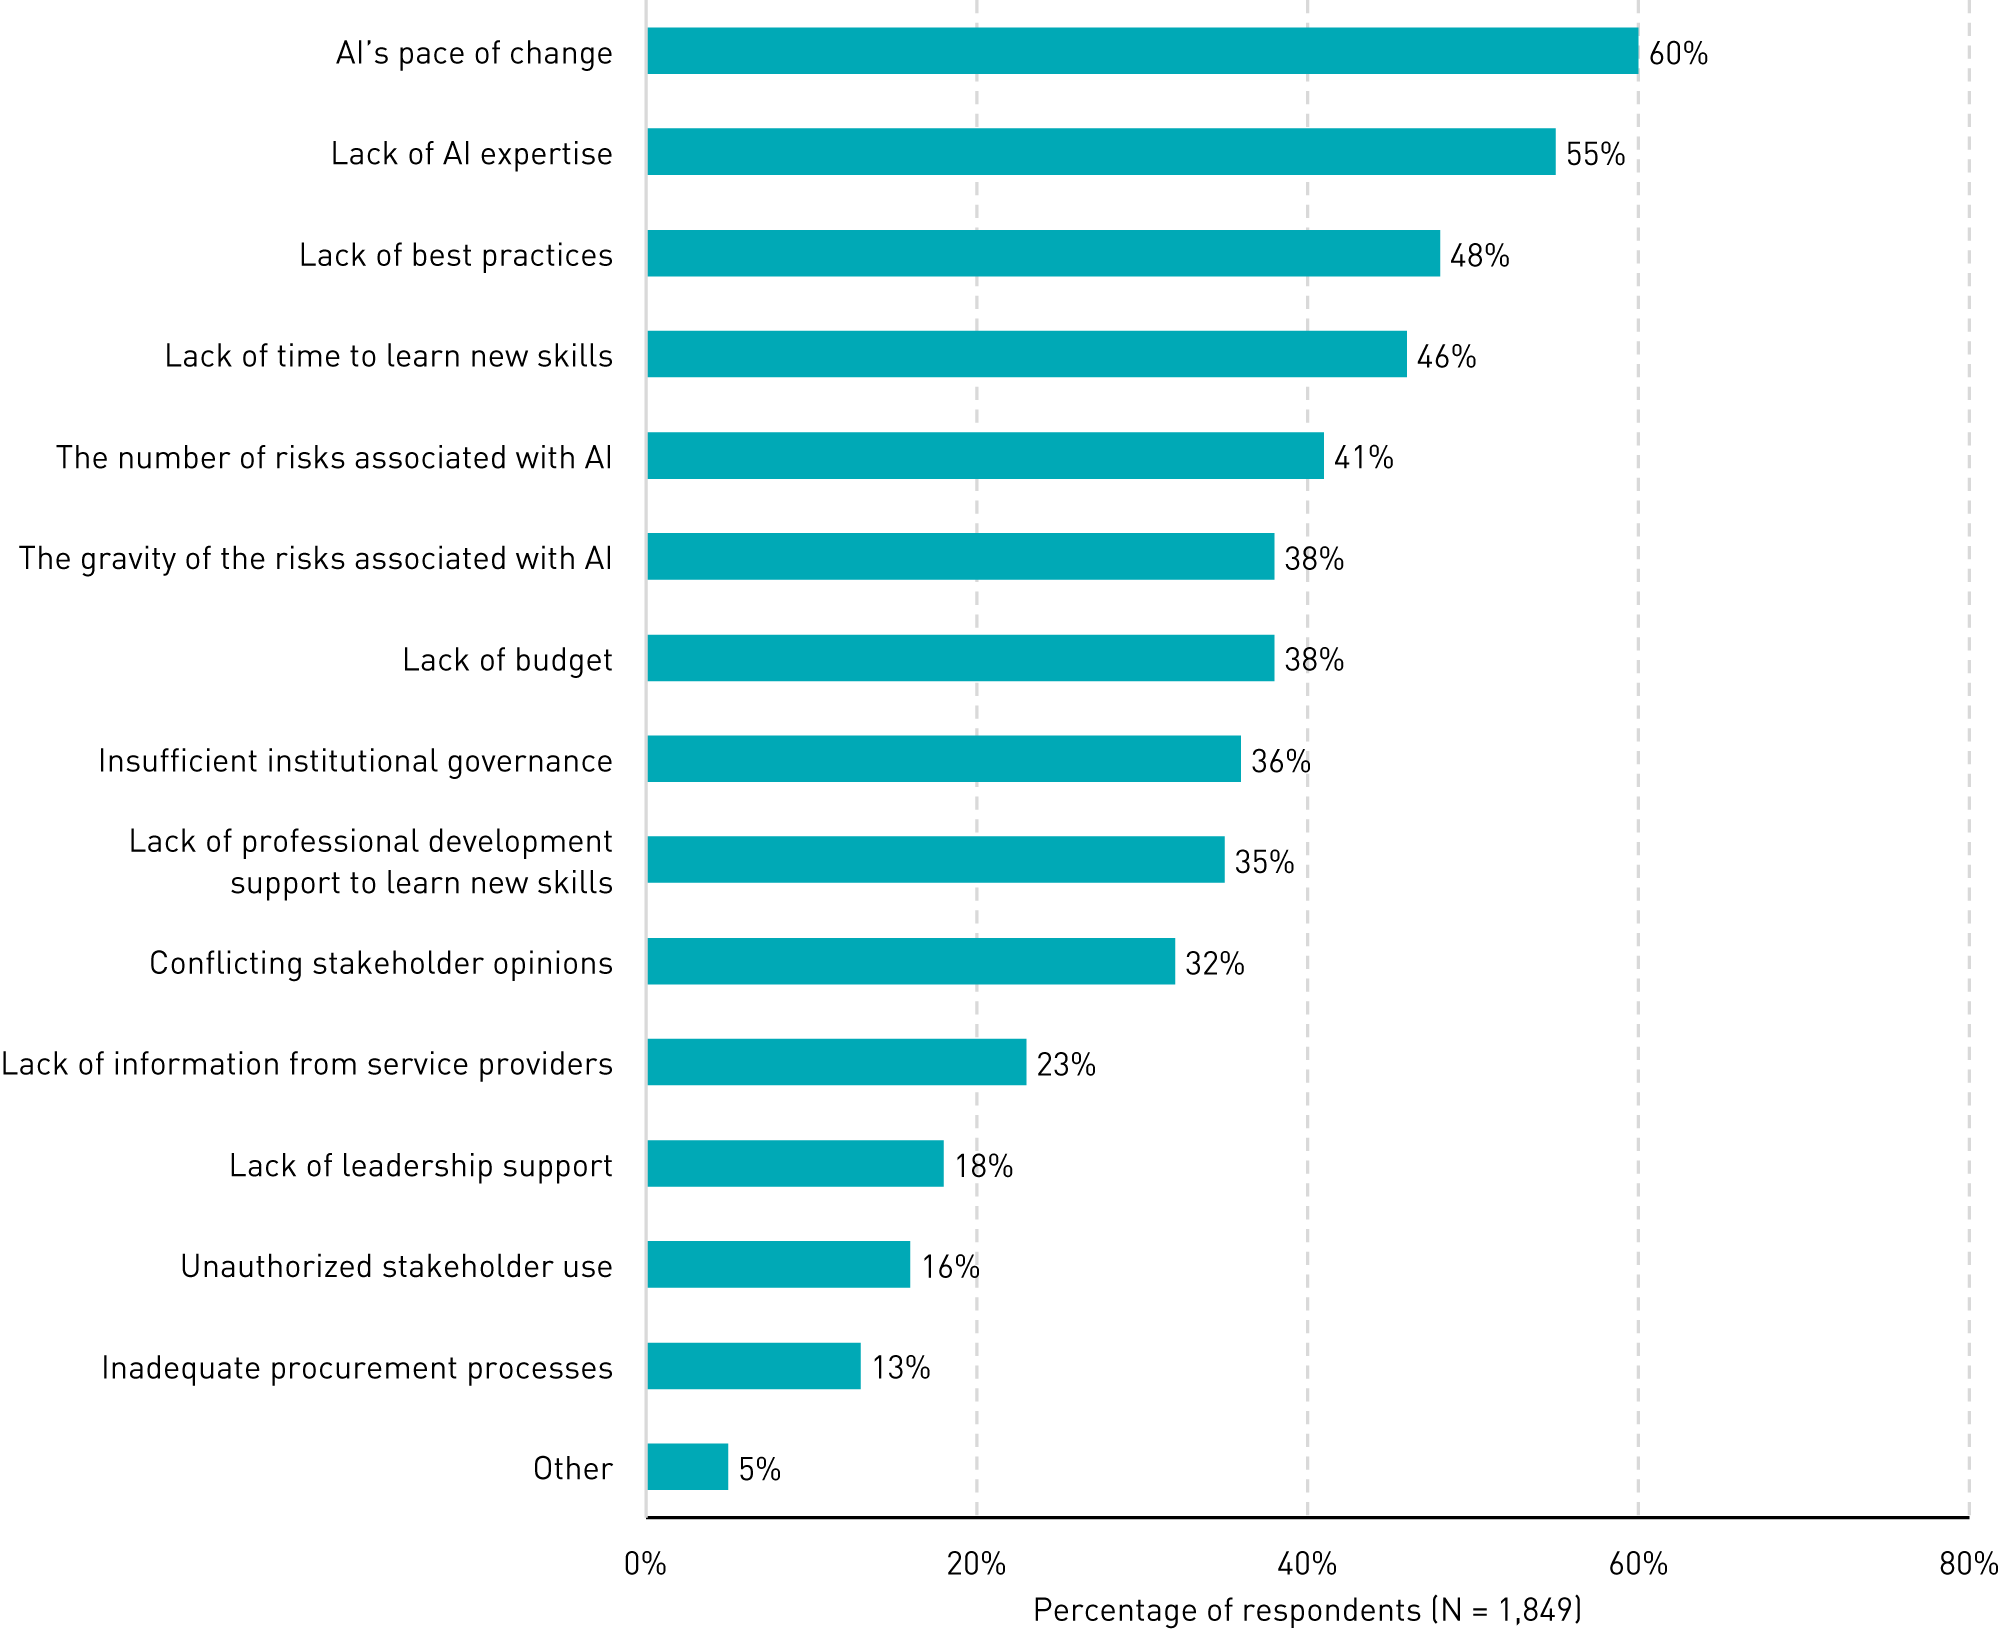
Even as respondents expressed optimism for the promising opportunities AI tools bring to their work, they identified a number of challenges associated with using the technology. The five most-selected challenges from a closed-ended list of items are AI's pace of change (60%), lack of AI expertise (55%), lack of best practices (48%), lack of time to learn new skills (46%), and the number of risks associated with AI (41%, see figure 11).2 In open-ended comments, respondents also described the following challenges:
- Unsubstantiated "hype" or "techno-utopianism" (i.e., the idea that technology can bring about a utopian future)
- Unequal access to AI tools, especially based on price
- Poor fit of specific tools to work tasks
- Lack of appropriate technology infrastructure
- Lack of ability to mitigate environmental impact
Respondents were also asked to reflect on discipline-specific risks, opportunities, and challenges related to their job roles. Though some respondents mentioned opportunities (such as offloading simple tasks), most responses focused on risks or challenges:
- Eliminating jobs in which humans intermediate between nontechnical users and software, systems, or hardware
- Replacing subject-matter experts with bots and not including a human in the loop
- Lack of entry-level jobs
- Lack of voice from job candidates in application materials
- Fabricated application materials
- Library database terms of agreement that do not align with fair use
- Lack of coordination between IT and HR for work-related policy
- Serving students who are subject to a wide variety of policies from different academic and operational units
- Adding a large new area of responsibility to some job roles (e.g., CIO)
- Poor generation of data visualizations and graphics
- Inability to keep up with new and evolving cybersecurity threats enabled by AI
Use Cases
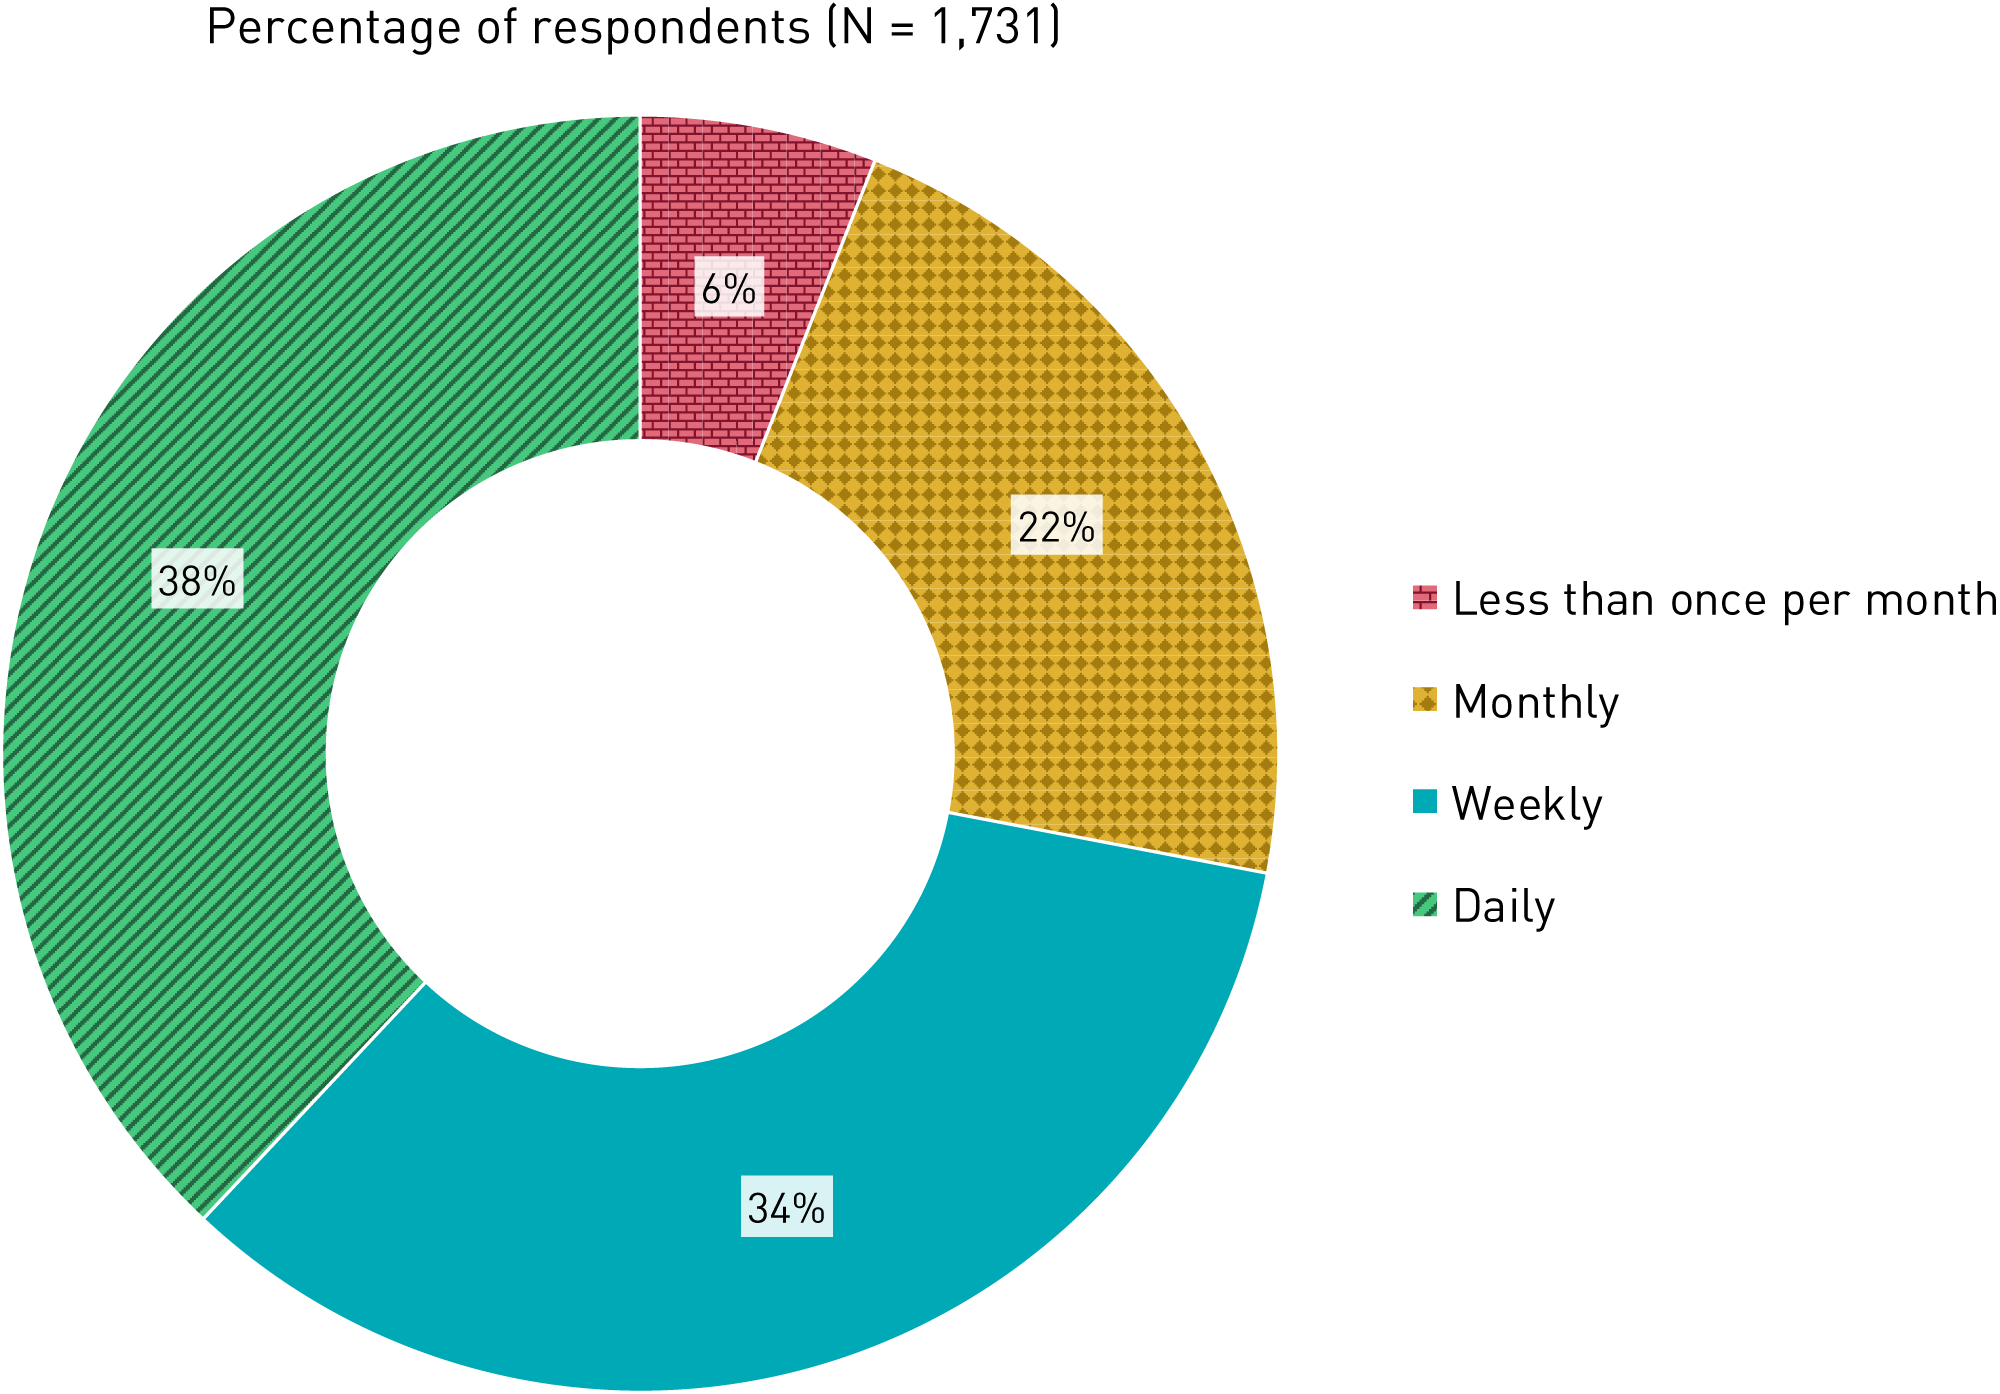
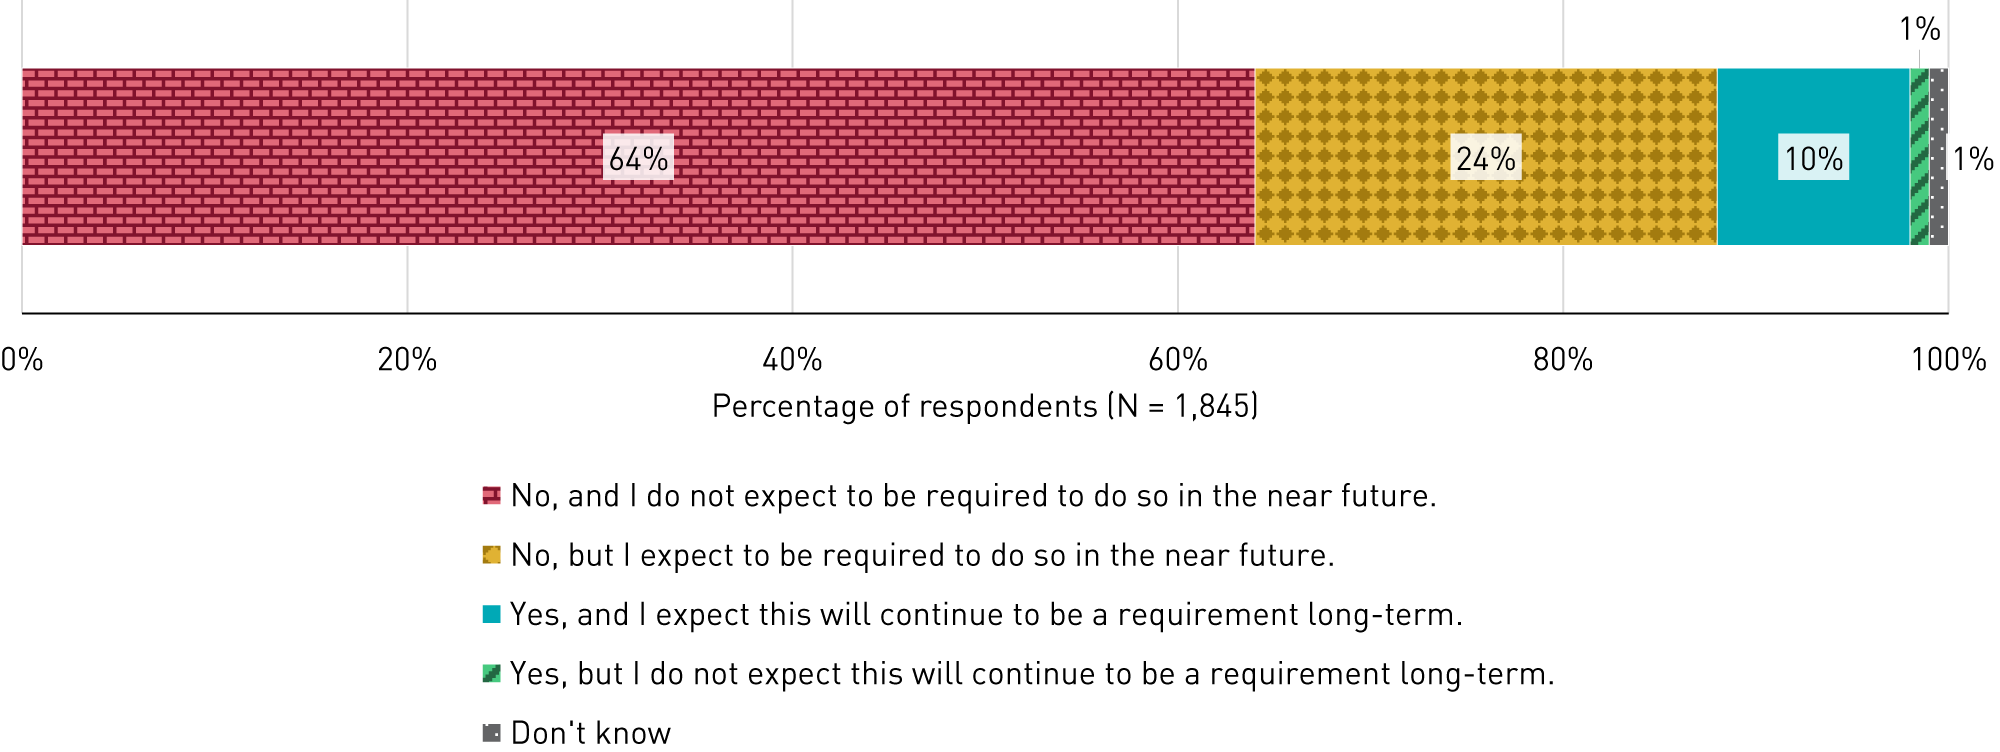
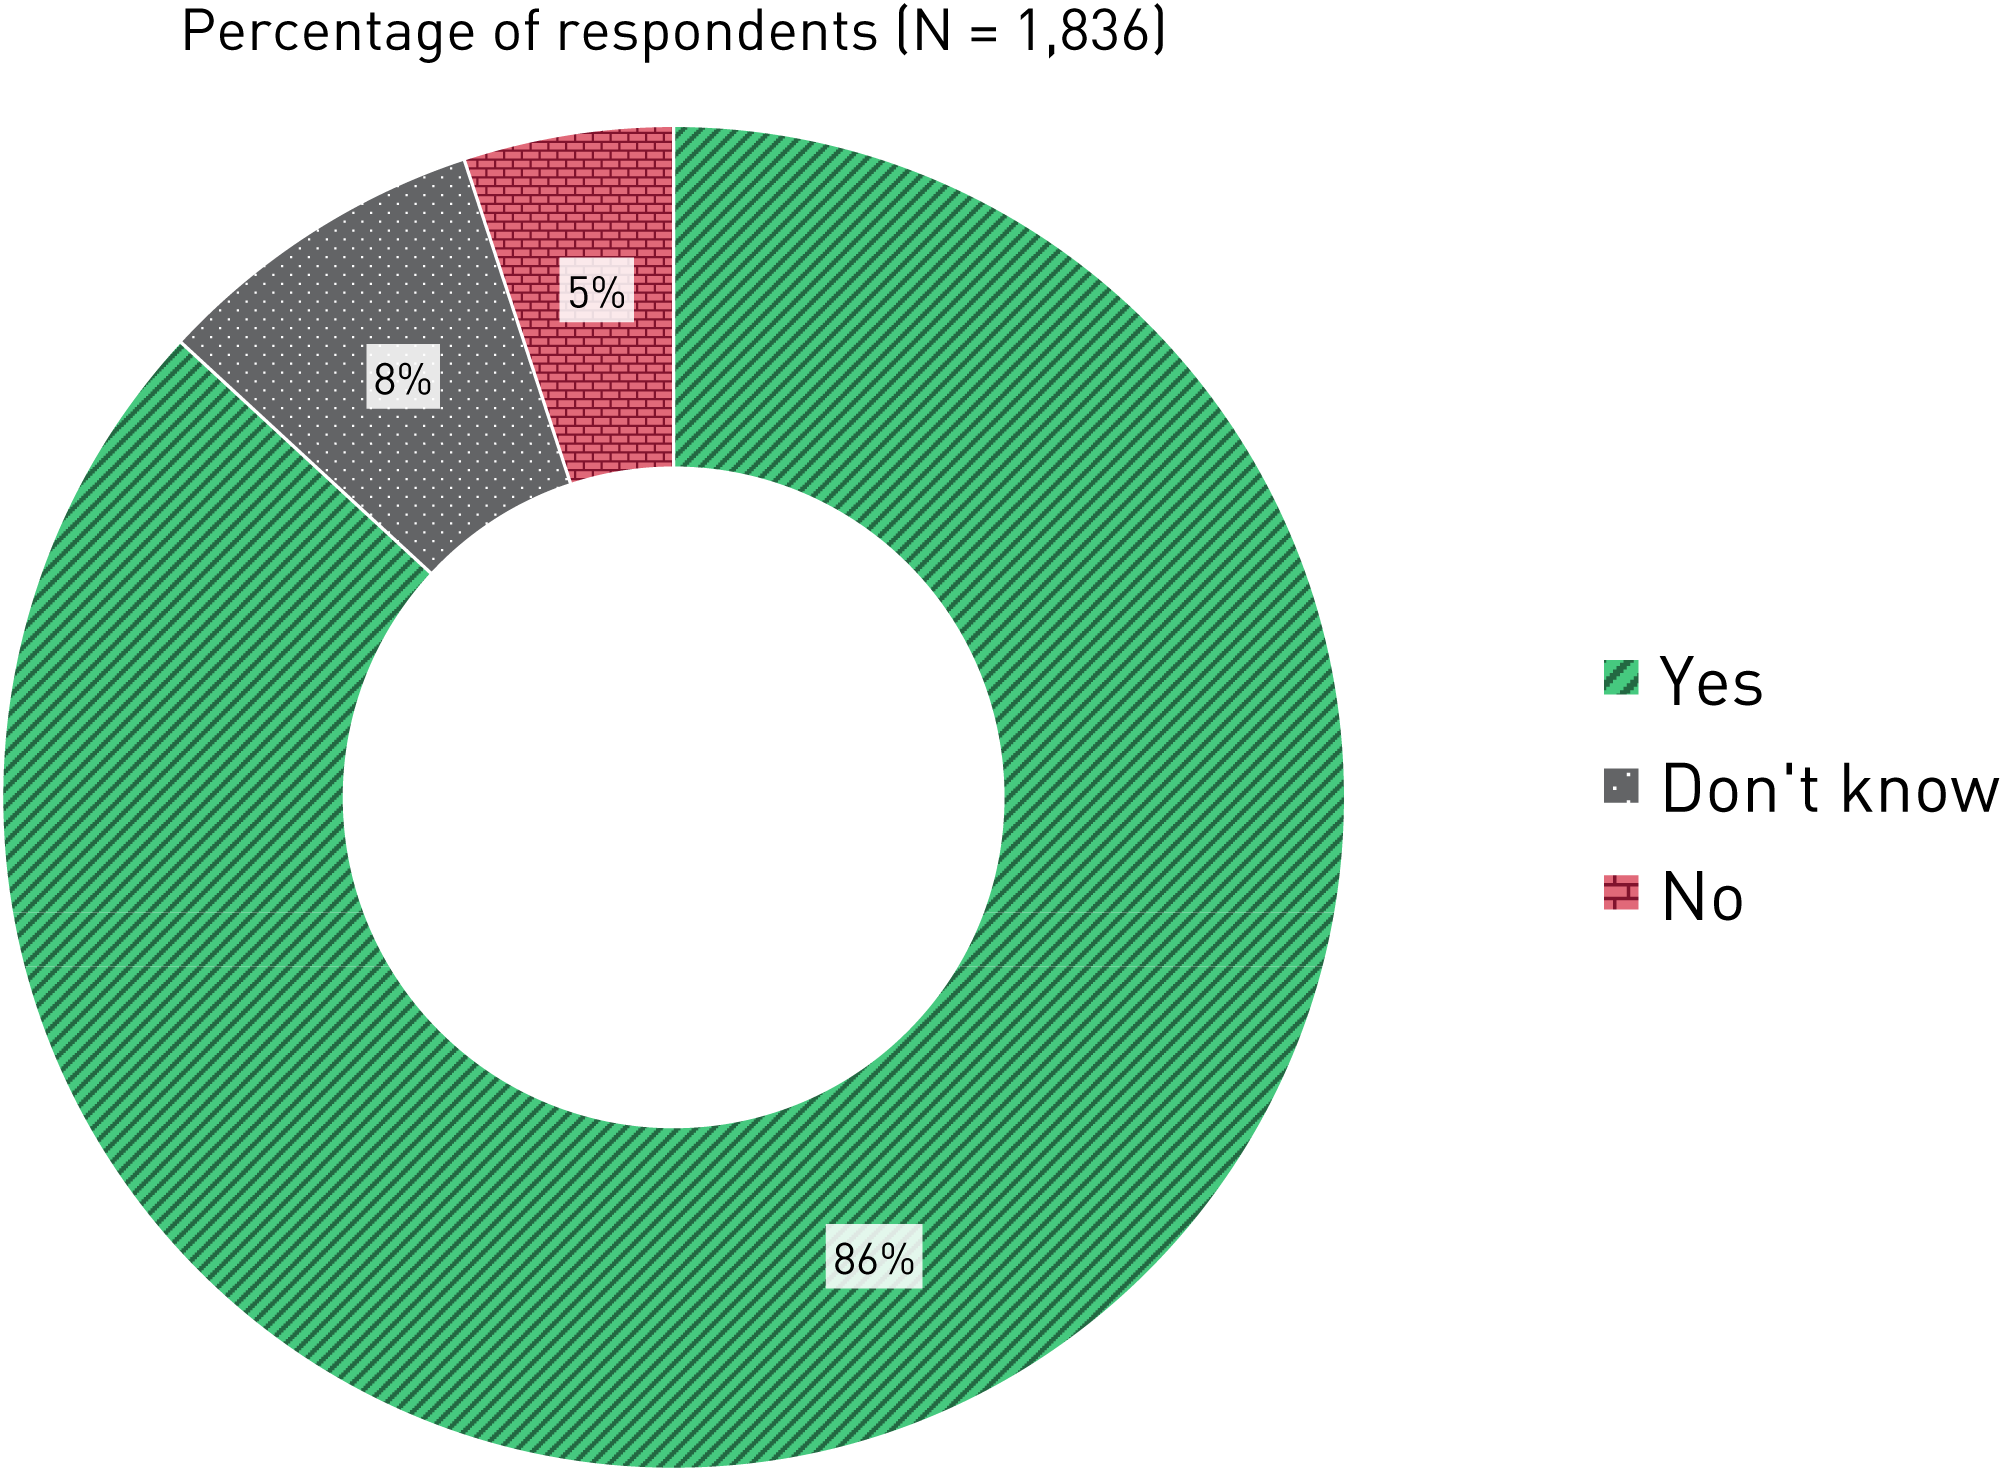
The majority of work-related AI tool use is voluntary. As previously described in this research report, nearly all respondents (94%) indicated that they have used AI tools for work-related tasks in the past six months (see figure 5). Of respondents who have recently used AI tools for work-related tasks, a majority reported that they do so either daily (38%) or weekly (34%, see figure 12). Of respondents who have not recently used AI tools for work-related tasks, the most common reasons given were that they either did not want to (58%) or did not need to (50%). Indeed, a mere 11% of respondents reported that they are required to use AI tools for work, and a majority (64%) reported that not only are they not required to use AI tools for work, but they do not expect to be required to do so in the near future (see figure 13). Even with this lack of obligation to use AI tools, a majority of respondents (86%) indicated that they want to use—or continue to use—AI tools in the future (see figure 14).
Staff and faculty use AI tools for many work-related tasks. Respondents were asked to review a list of 30 potential work-related uses of AI tools (including an open-ended "Other" option) and select those for which they had used AI tools within the past six months (see figure 15). Strikingly, more than half (54%) chose eight or more items from the list, indicating that staff and faculty are leveraging AI tools for a wide range of activities. The five most-selected items from the list are brainstorming (63%), drafting emails (62%), summarizing long documents or meetings (61%), proofreading or copyediting (56%), and creating presentations (47%). Just one substantial difference emerged from the data when disaggregating by job role or functional area: A majority of faculty (63%) reported that they have used AI tools for creating learning activities or assessments in the past six months, as compared to just 32% of staff.
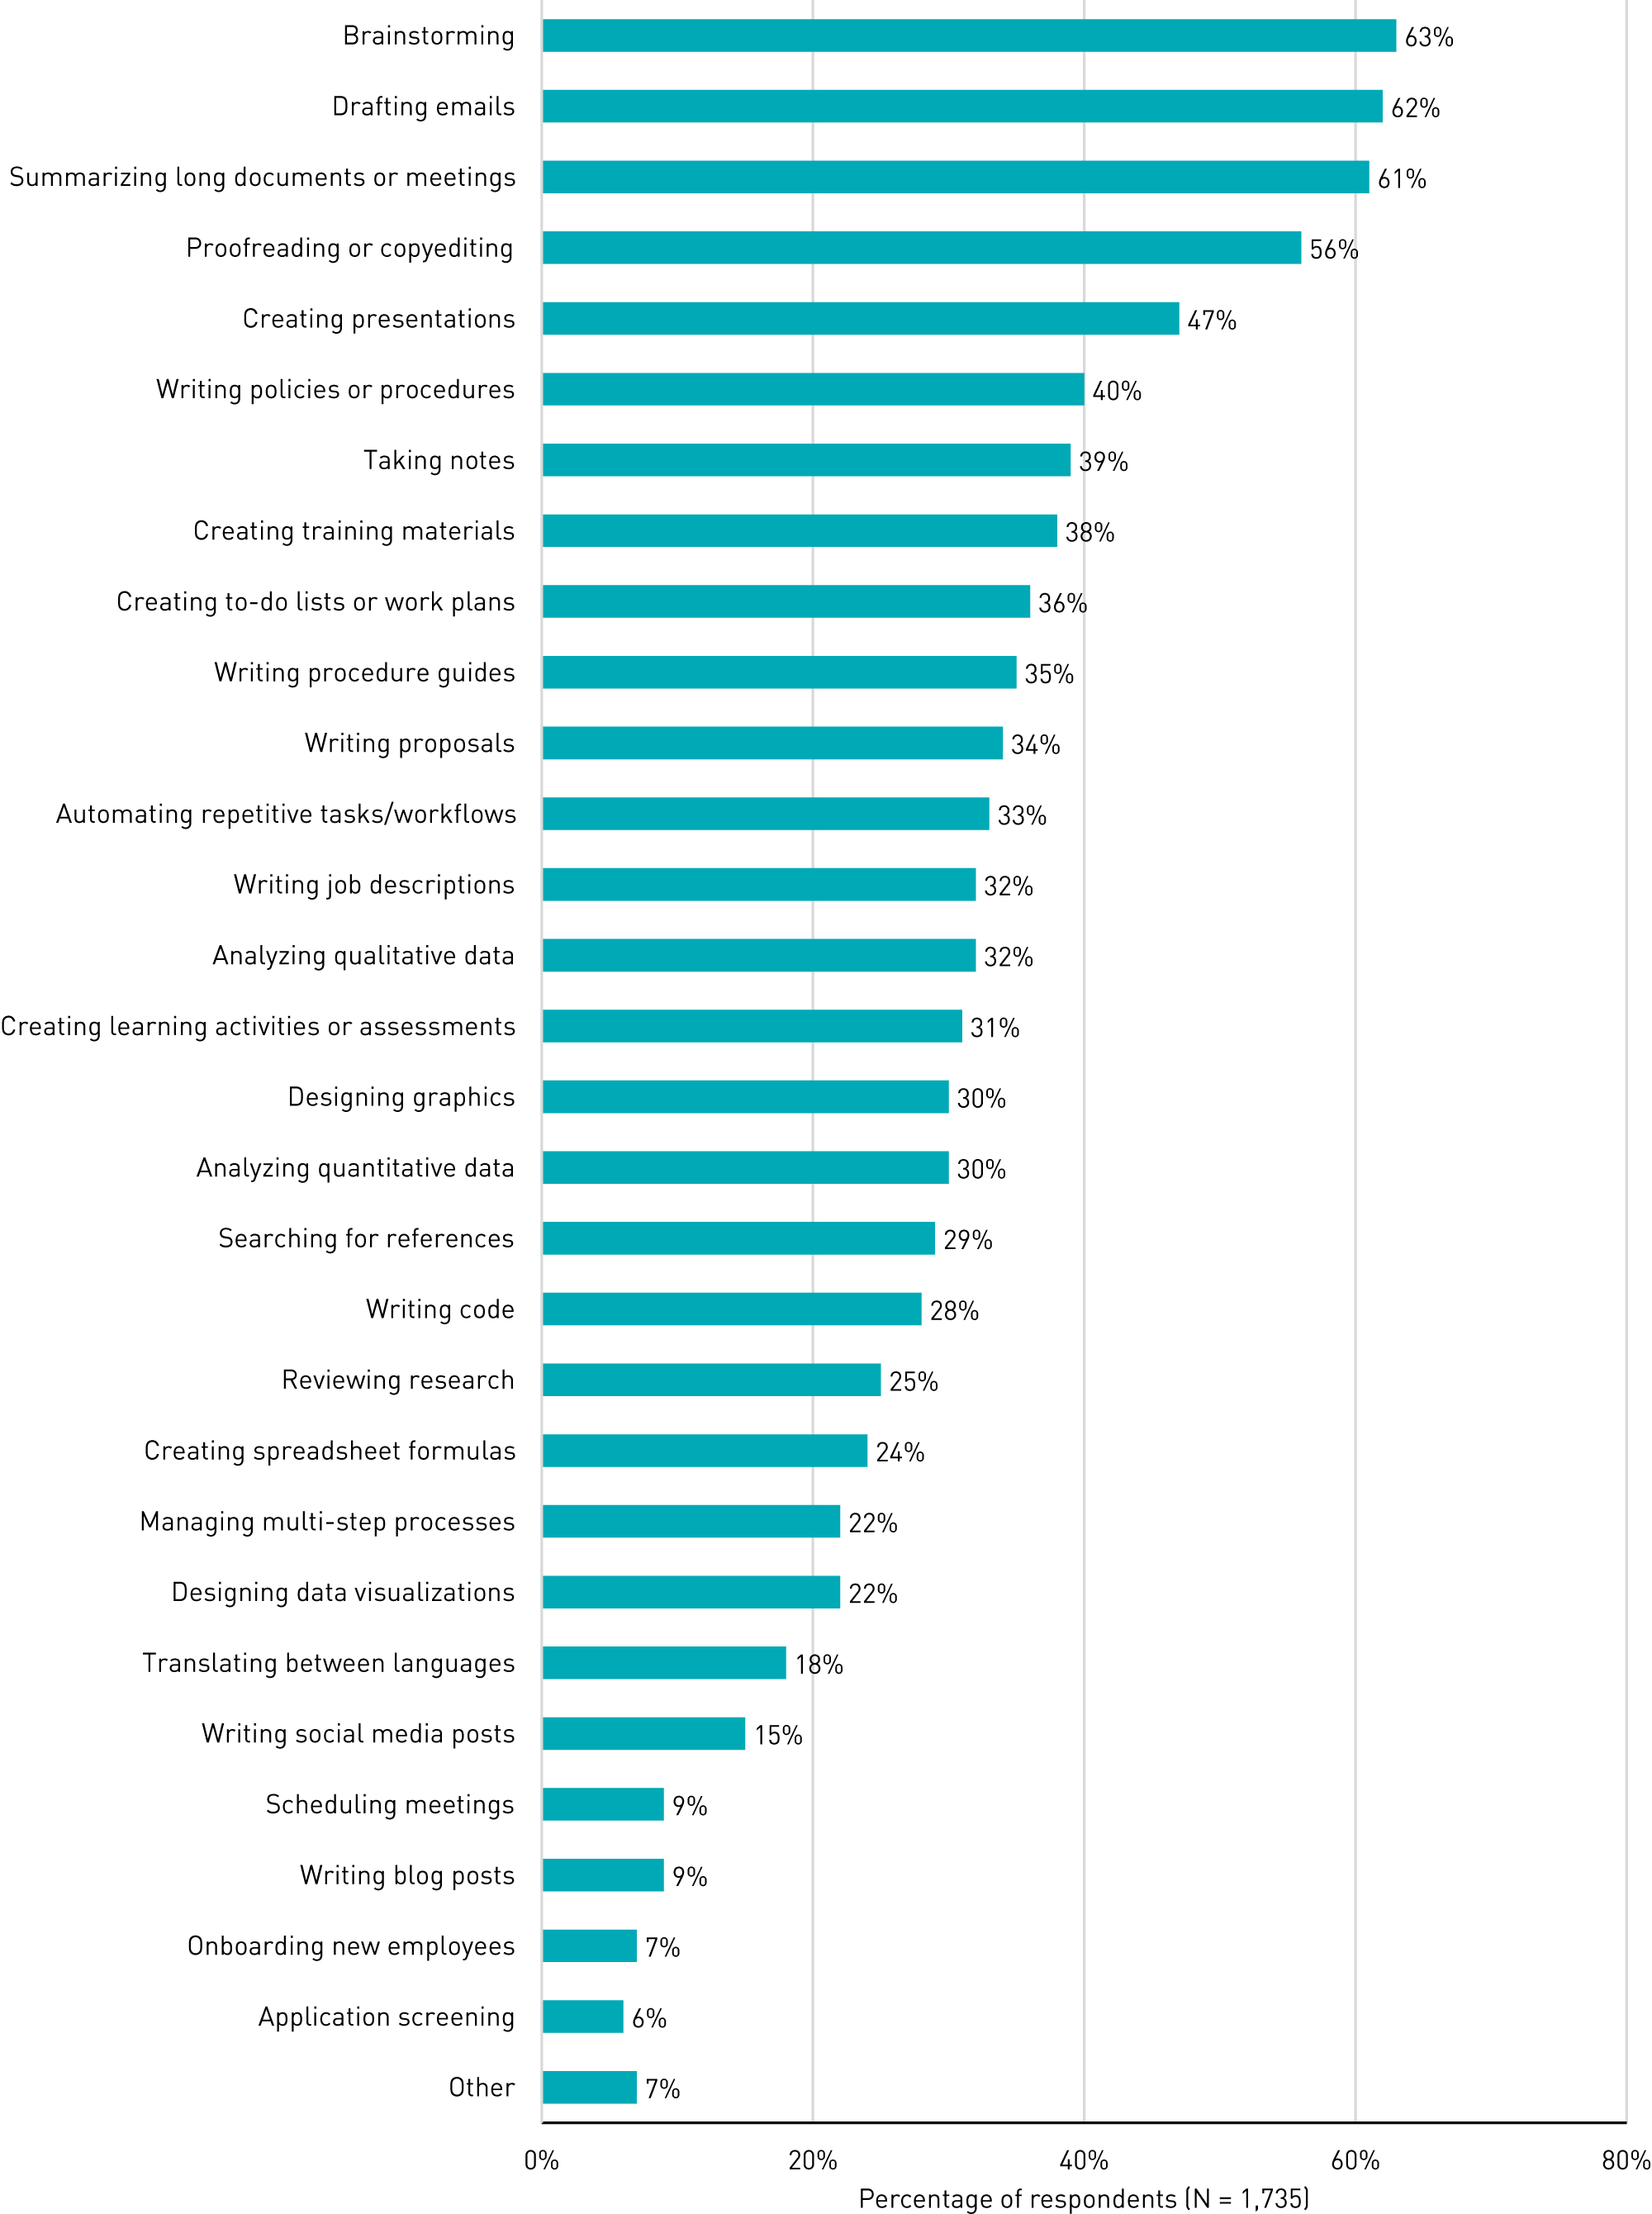
The least-selected items in the list of work-related use of AI included writing social media posts (15%), scheduling meetings (9%), writing blog posts (9%), onboarding new employees (7%), and application screening (6%). Certainly, some use cases don't fit with certain staff or faculty job functions, but more data are required to understand why staff and faculty are choosing to use AI tools for some tasks over others. Some potential explanations include preferring to use AI tools for professional but not personal communication, avoiding the use of AI tools for high-stakes activities, and perceiving a lack of adequate AI tools for certain work-related tasks.
In open-ended comments, respondents provided other work-related uses of AI tools, such as creating accessible content, creating customized AI language models, rehearsing conversations, creating podcasts and videos, learning new skills, and technical troubleshooting. One respondent noted that it can be difficult to know when a tool is leveraging AI capabilities: "[AI] tools are embedded into our school's software packages, so you don't really know when you are being prompted or given a suggestion by AI. The lines are blurred, but you are receiving aid."
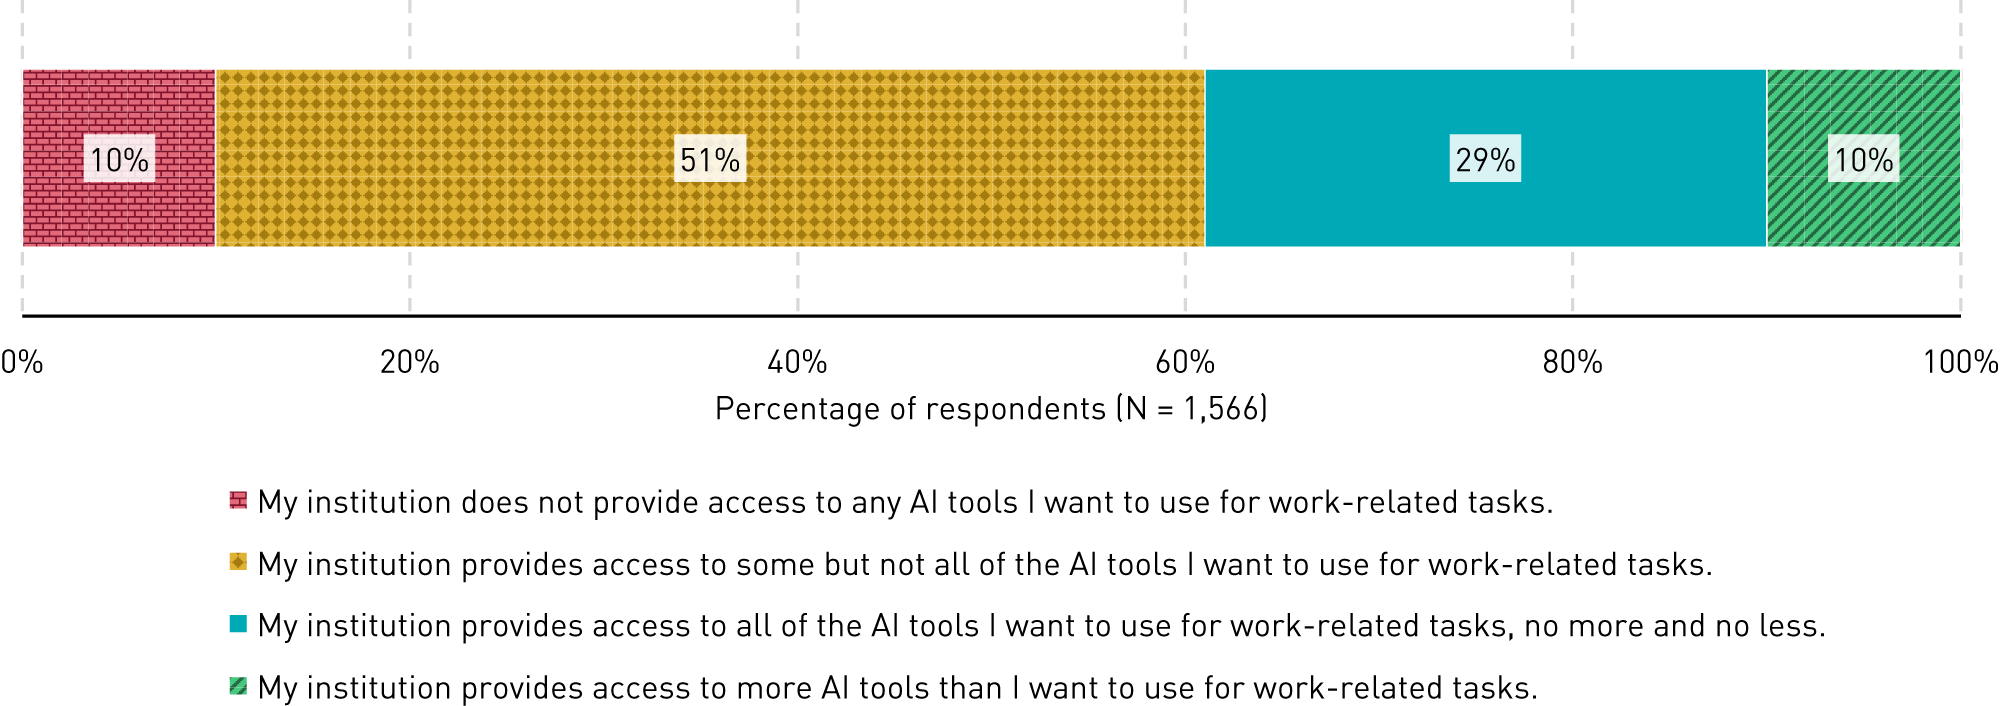
Institutions provide access to most (but not all) of the tools staff and faculty want to use for work. Among respondents who said they want to use or continue to use AI tools for work, just over half (51%) reported that their institution provides access to some but not all of the AI tools they want, with 39% reporting that their institution provides access to all of the tools they want to use, plus some. A mere 10% of respondents indicated that their institution does not provide access to any of the tools they want to use for work (see figure 16). The one notable difference when data are disaggregated by job role is that nearly a quarter (23%) of faculty respondents indicated that their institution does not provide access to any of the tools they want to use for work.
In an open-ended question, respondents were asked to list the specific tools they have used for work-related tasks in the past six months. The tools mentioned most often (by at least 10 respondents) are ChatGPT, Copilot, Gemini, Claude, Perplexity, NotebookLM, Canva, Grammarly, Adobe Creative Cloud (e.g., Express, Firefly, Acrobat), Zoom AI Companion, Gamma, Grok, Copilot Studio, BoodleBox, Consensus, Midjourney, and Sora.
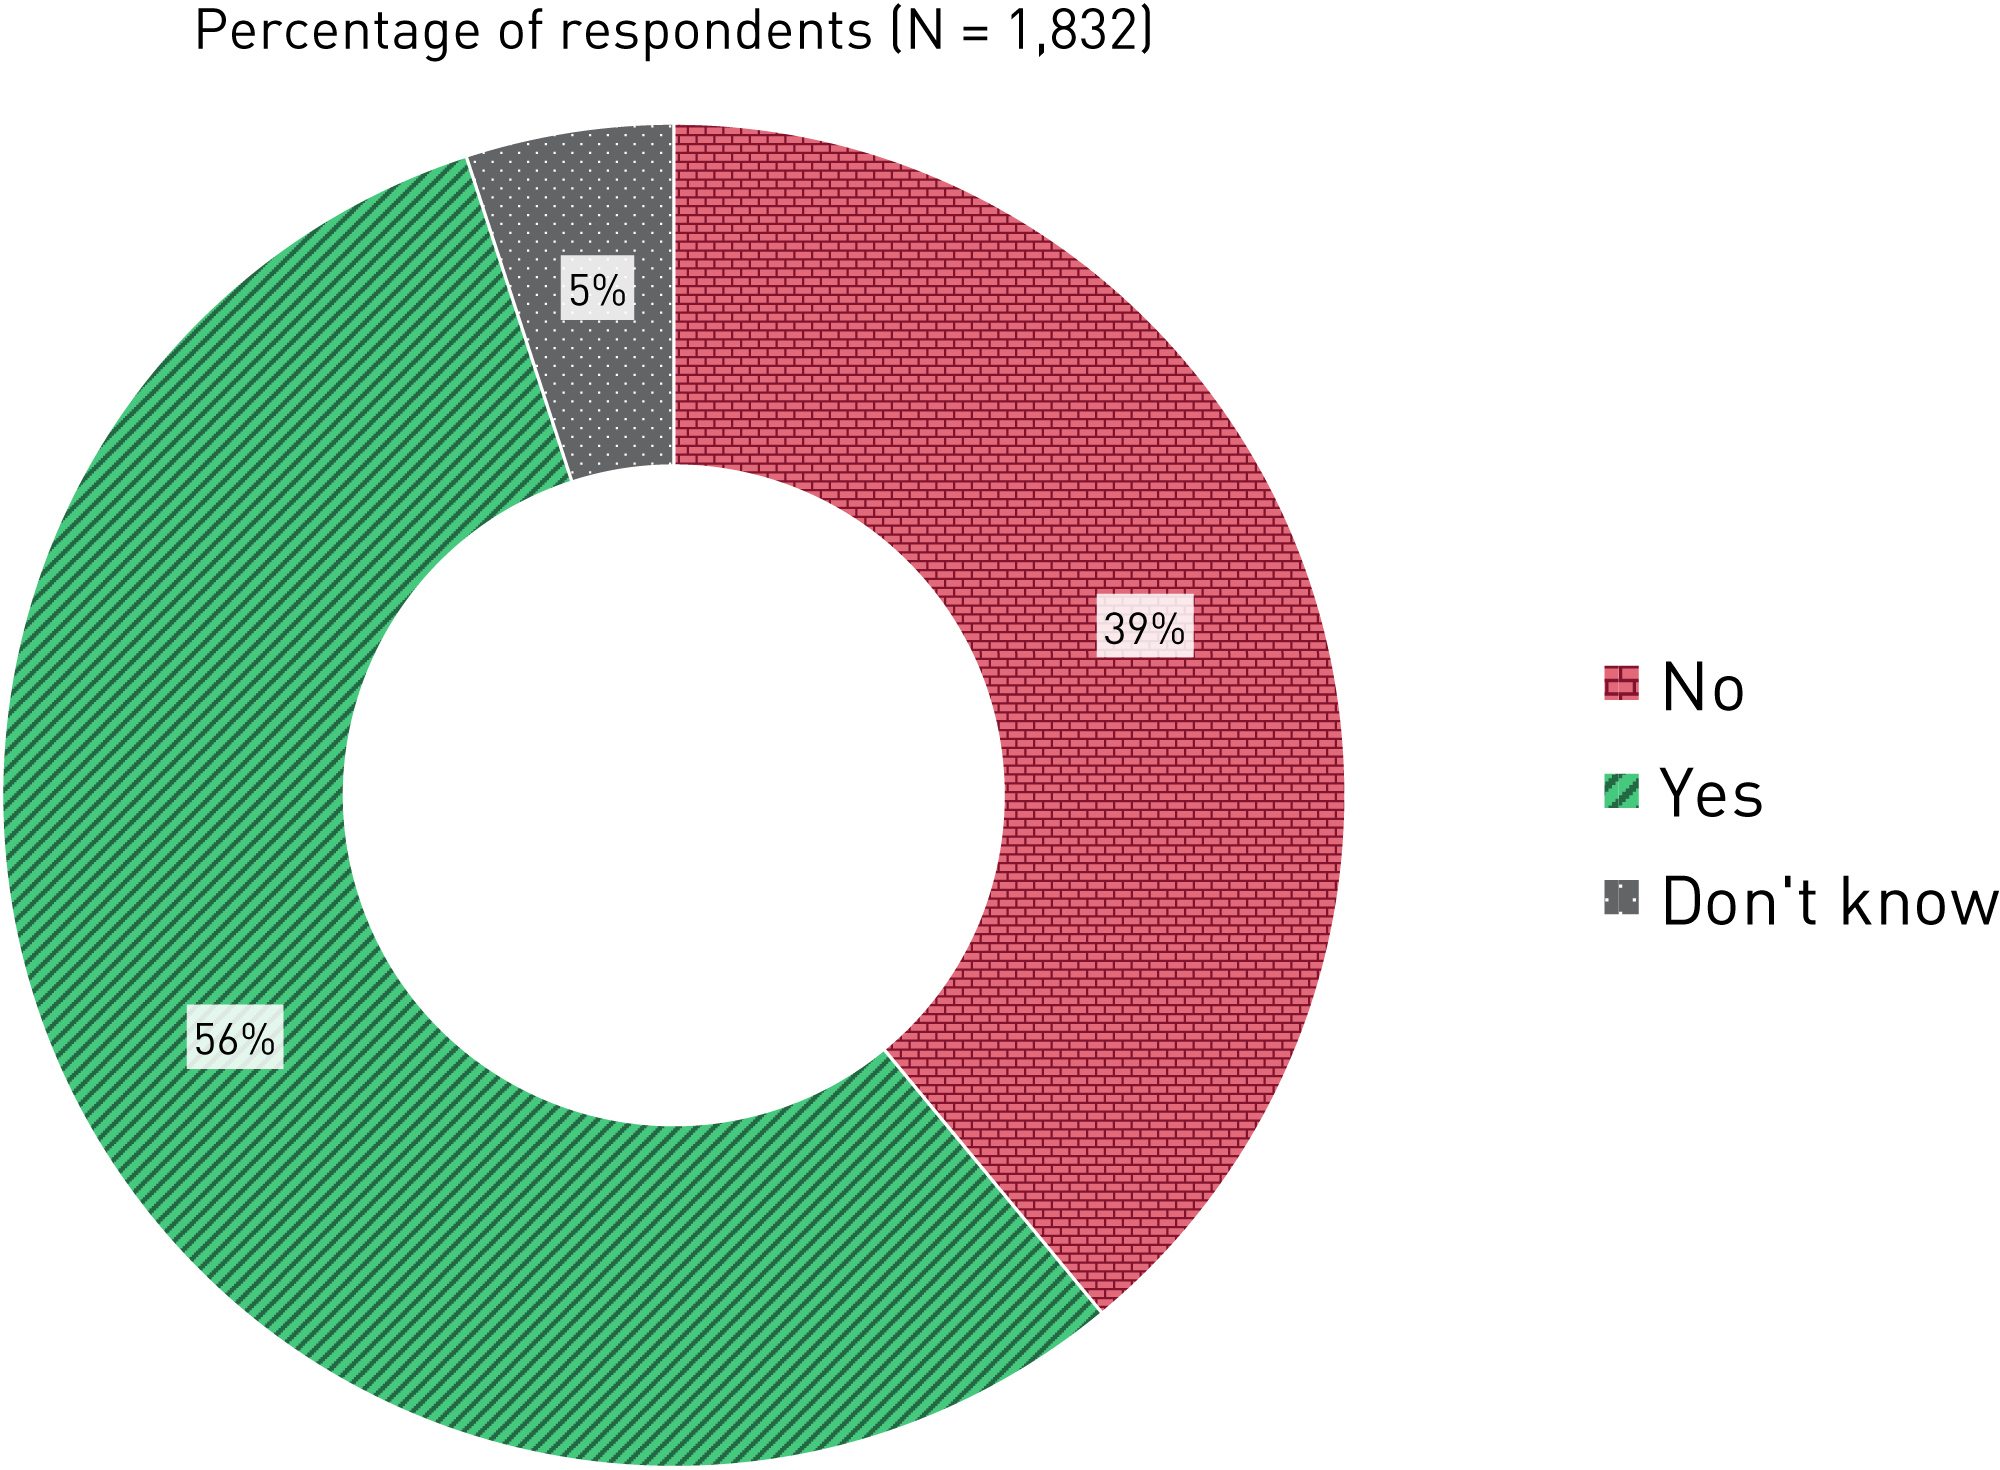
More than half of respondents (56%) reported that they have used AI tools that are not provided by their institutions for work-related tasks (see figure 17). This is a significant finding because tools that have not been provided by the institution may not have been evaluated on important metrics such as data privacy and cybersecurity, accuracy and reliability, accessibility, protection of copyright and intellectual property, environmental impact, and more.
Next Steps
Based on the insights generated by these data, here are some actions you can take:
- Communicate with staff and faculty about work-related AI strategy, and include them in strategic planning whenever possible.
- Beyond encouraging staff and faculty to develop their own work-related AI skills, provide formal support such as in-house training or access to professional development from third-party providers.
- Codify new AI-related work responsibilities in job descriptions to facilitate access to resources, ensure that expectations are clear, and formally acknowledge AI-related work. This step also mitigates the risk of burnout among staff and faculty who are being asked to take on more work.
- Measure the return on investment for new AI-related expenditures, and communicate with staff and faculty so they know how AI tools are being evaluated.
- Create clear work-related AI policies and guidelines, and communicate with staff and faculty to be sure they are aware of them.
- Collect data from staff and faculty at your institution to better understand the greatest opportunities, risks, and challenges associated with using AI tools for work in your local context.
- Ask staff and faculty at your institution whether and how they want to use AI tools for work. After vetting tools, provide them with the ones they need, which will help mitigate the risk that they will use unapproved tools.
- Provide staff and faculty opportunities to communicate with leadership about emerging AI use cases.
Check out the following AI-related resources from EDUCAUSE:
- The AI page in the EDUCAUSE Library provides links to AI-related events, research, publications, and more.
- The Event Finder will help you find upcoming events of all kinds, including webinars, courses, Learning Labs, QuickTalks, and conferences.
- Join the AI Community Group to discuss the issues and opportunities related to pedagogical, ethical, privacy, and other aspects of generative AI impacting students, staff, and faculty across higher education.
- EDUCAUSE Horizon Reports and Action Plans help you consider potential futures so you can be proactive rather than reactive.
- The EDUCAUSE Top 10 and the EDUCAUSE Showcase Series offer in-depth explorations of the most urgent issues identified each year by the higher education community.
Methodology and Acknowledgments
Methodology
The survey for this research comprised 34 closed- and open-ended items. The full survey instrument is available online. The survey was distributed via email by EDUCAUSE, AIR, NACUBO, and CUPA-HR on September 29, 2025, and remained open until October 13, 2025, resulting in 1,960 responses meeting inclusion criteria:
- Respondent currently (at the time of survey taking) works at a higher education institution.
- Respondent answers the following questions:
- Which of the following best describes your primary position/role at your institution?
- Which of the following best describes your primary area of responsibility at your institution?
- How would you characterize your general attitude toward AI?
- Are you aware of any policies or guidelines that are meant to guide (or prohibit) your work-related use of AI?
Data from closed-ended survey items were analyzed with IBM SPSS Statistics. Open-ended survey data were coded manually and with NVivo 15.3.1 (including limited coding with NVivo AI Assistant). Quantitative data presented in this report were rounded to the nearest whole number. Open-ended respondent quotes presented in this report were lightly edited for readability. This research is limited by standard survey limitations such as constrained sample frame and response biases.
Acknowledgments
EDUCAUSE Research and Insights is sincerely grateful to every individual who took the time to answer these survey questions. Without your contributions, this work would not be possible. We also thank the entire EDUCAUSE team for supporting this work, including but not limited to data analysis, data visualization, marketing, project management, and editing. Finally, thank you to our colleagues at AIR, NACUBO, and CUPA-HR for your collaboration in this work.
Respondent Demographics
| Role | Percentage of respondents (N = 1,960) |
|---|---|
| Manager or director |
39% |
| Professional/staff |
32% |
| Executive leader |
16% |
| Faculty |
12% |
| Other |
1% |
| Area | Percentage of respondents (N = 1,960) |
|---|---|
| Teaching and learning |
35% |
| Business and operations |
29% |
| Technology |
22% |
| Data and analytics |
11% |
| Cybersecurity and data privacy |
2% |
| Other |
1% |
| Years of Service | Percentage of respondents (N = 1,579) |
|---|---|
| 10 years or longer |
75% |
| 6–9 years |
10% |
| 3–5 years |
8% |
| 1–2 years |
7% |
| Less than 1 year |
0% (N = 3) |
| Students enrolled in fall 2025 or equivalent | Percentage of respondents (N = 1,833) |
|---|---|
| Under 1,000 |
4% |
| 1,000–4,999 |
23% |
| 5,000–9,999 |
14% |
| 10,000–19,999 |
16% |
| 20,000 and above |
37% |
| Don't know |
6% |
| Sector | Percentage of respondents (N = 1,829) |
|---|---|
| Public |
67% |
| Private not-for-profit, independent (no religious affiliation) |
19% |
| Private not-for-profit (religious affiliation) |
9% |
| Private for-profit |
4% |
| Don't know |
1% |
| Level | Percentage of respondents (N = 1,826) |
|---|---|
| 4 or more years |
77% |
| At least 2 but less than 4 years |
19% |
| Less than 2 years |
2% |
| Don't know |
1% |
| Status | Percentage of respondents (N = 1,831) |
|---|---|
| Degree-granting (offers associate's, bachelor's, master's, doctoral, or first-professional degrees) |
98% |
| Non-degree-granting (offers certificates or other formal awards) |
1% |
| Don't know |
1% |
| U.S. based | Percentage of respondents (N = 1,828) |
|---|---|
| No |
10% |
| Yes |
89% |
| Don't know |
0% (N = 6) |
| Status | Percentage of respondents (N = 1,830) |
|---|---|
| Not MSI |
69% |
| MSI |
23% |
| Don't know |
9% |
| Characteristic | IPEDS Population Size | Percent of IPEDS Population Size | Number of Survey Respondents | Percent of Survey Respondents |
|---|---|---|---|---|
| Sector of institution | ||||
| Public |
1,821,784 |
64% |
993 |
67% |
| Private |
1,037,942 |
36% |
483 |
33% |
| Total |
2,859,726 |
100% |
1,476 |
100% |
| Level of institution | ||||
| At least 2 but less than 4 years |
376,289 |
13% |
275 |
19% |
| 4 or more years |
2,483,437 |
87% |
1,201 |
81% |
| Total |
2,859,726 |
100% |
1,476 |
100% |
| Institution size (students enrolled in fall 2025 or equivalent) | ||||
| Under 1,000 |
106,989 |
4% |
53 |
4% |
| 1,000–4,999 |
611,665 |
21% |
372 |
25% |
| 5,000–9,999 |
395,157 |
14% |
215 |
15% |
| 10,000–19,999 |
564,734 |
20% |
247 |
17% |
| 20,000 and above |
1,181,181 |
41% |
589 |
40% |
| Total |
2,859,726 |
100% |
1,476 |
100% |
 EDUCAUSE Mission Partners
EDUCAUSE Mission Partners collaborate deeply with EDUCAUSE staff and community members on key areas of higher education and technology to help strengthen collaboration and evolve the higher ed technology market. Learn more about EDUCAUSE Mission Partners, and how they're partnering with EDUCAUSE to support your evolving technology needs.
Learn More
Access additional materials on the hub page.
Jenay Robert. The Impact of AI on Work in Higher Education. Research report. Boulder, CO: EDUCAUSE, January 2026.
© 2026 EDUCAUSE. The content of this work is licensed under a Creative Commons BY-NC-ND 4.0 International License.