Digital Transformation Signals: Culture, Workforce, and Technology Shifts

Digital Transformation: Technology Shifts

Various technology shifts signal the presence of and engagement in Dx at an institution. The Dx technology shifts identified below are being adopted at a plurality of responding institutions. It is important to note that nearly all trends and aspects of Dx have a sizable percentage of institutions currently moving forward…with others already lagging behind.

Institutions are supporting their technologies with evolving management and governance practices and lagging in their adoption of emerging technologies such as robotics, blockchain, and machine learning.

What Are Institutions Doing?

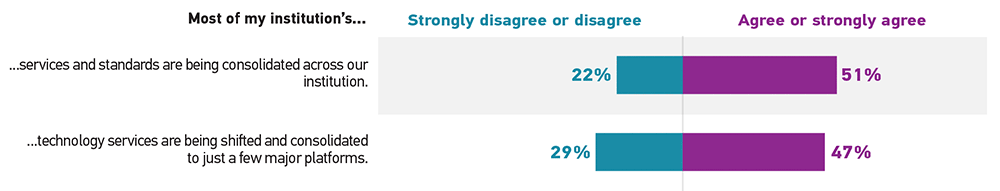
Institutions are consolidating services and standards across the institution and shifting or consolidating technology services to just a few platforms (see figure 16).

Bar graph showing the percentage of respondents who 'Strongly disagree or disagree' (Disagree) and 'Agree or strongly agree' (Agree) for each statement.  Most of my institution’s services and standards are being consolidated across our institution: Disagree 22%, Agree 51%. Most of my institution’s technology services are being shifted and consolidated to just a few major platforms: Disagree 29%, Agree 47%.
Figure 16. Institutions: Consolidation of services and standards


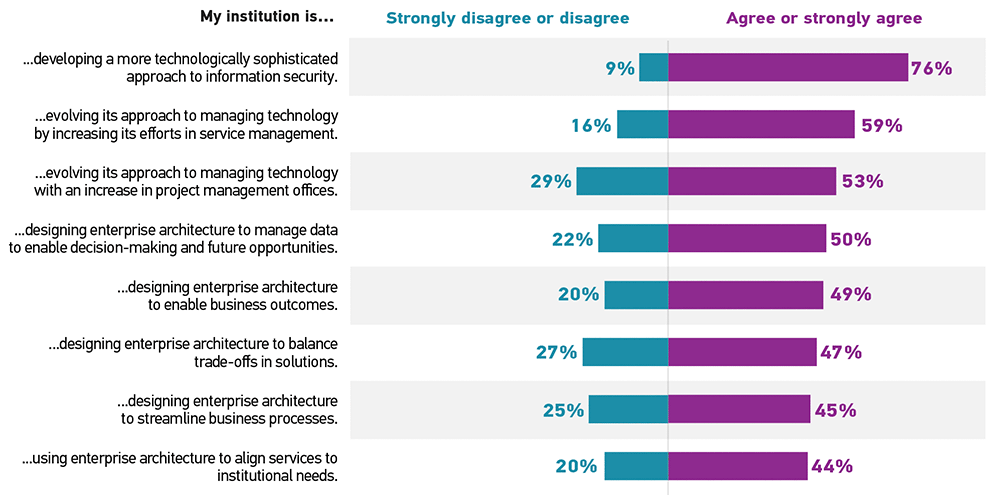
Institutions are developing their technology approaches to information security and evolving their general approaches to technology through project and service management (see figure 17).

Bar graph showing the percentage of respondents who 'Strongly disagree or disagree' (Disagree) and 'Agree or strongly agree' (Agree) for each statement.  My institution is developing a more technologically sophisticated approach to information security: Disagree 9%, Agree 76%. My institution is evolving its approach to managing technology by increasing its efforts in service management: Disagree 16%, Agree 59%. My institution is evolving its approach to managing technology with an increase in project management offices: Disagree 29%, Agree 53%. My institution is designing enterprise architecture to manage data to enable decision-making and future opportunities: Disagree 22%, Agree 50%. My institution is designing enterprise architecture to enable business outcomes: Disagree 20%, Agree 49%. My institution is designing enterprise architecture to balance trade-offs in solutions: Disagree 27%, Agree 47%. My institution is designing enterprise architecture to streamline business processes: Disagree 25%, Agree 45%. My institution is using enterprise architecture to align services to institutional needs: Disagree 20%, Agree 44%.
Figure 17. Institutions: Technology approaches


Institutions are offering personalized approaches to IT support and services (see figure 18).

Bar graph showing the percentage of respondents who 'Strongly disagree or disagree' (Disagree) and 'Agree or strongly agree' (Agree) for this statement.  My institution offers personalized approaches to IT support and services: Disagree 31%, Agree 39%.
Figure 18. Institutions: Personalized approaches to IT support and services


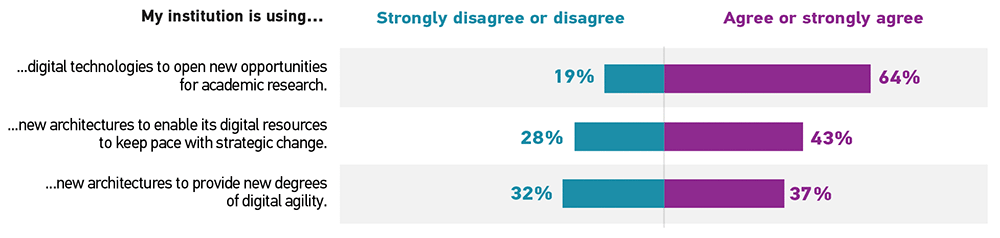
Institutions are advancing developments in research by using digital technologies to open up new opportunities (see figure 19).

Bar graph showing the percentage of respondents who 'Strongly disagree or disagree' (Disagree) and 'Agree or strongly agree' (Agree) for each statement.  My institution is using digital technologies to open new opportunities for academic research: Disagree 19%, Agree 64%. My institution is using new architectures to enable its digital resources to keep pace with strategic change: Disagree 28%, Agree 43%. My institution is using new architectures to provide new degrees of digital agility: Disagree 32%, Agree 37%.
Figure 19. Institutions: Research and digital technologies

What Areas Are Opportunities for Improvement?

Institutions are not consolidating services and standards across multiple institutions (see figure 20).

Bar graph showing the percentage of respondents who 'Strongly disagree or disagree' (Disagree) and 'Agree or strongly agree' (Agree) for this statement.  Most of my institution’s services and standards are being consolidated across multiple institutions: Disagree 49%, Agree 28%.
Figure 20. Institutions: Consolidation of services and standards


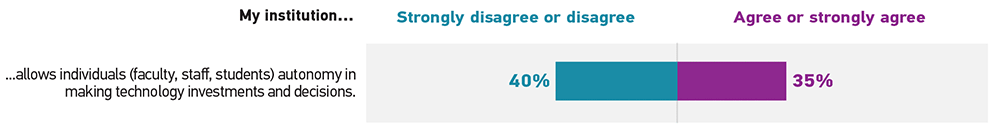
Institutions are not giving individuals (faculty, staff, students) the autonomy to make their own technology investments and decisions (see figure 21).

Bar graph showing the percentage of respondents who 'Strongly disagree or disagree' (Disagree) and 'Agree or strongly agree' (Agree) for this statement.  My institution allows individuals (faculty, staff, students) autonomy in making technology investments and decisions: Disagree 40%, Agree 35%.
Figure 21. Institutions: Autonomy of technology investments and decisions


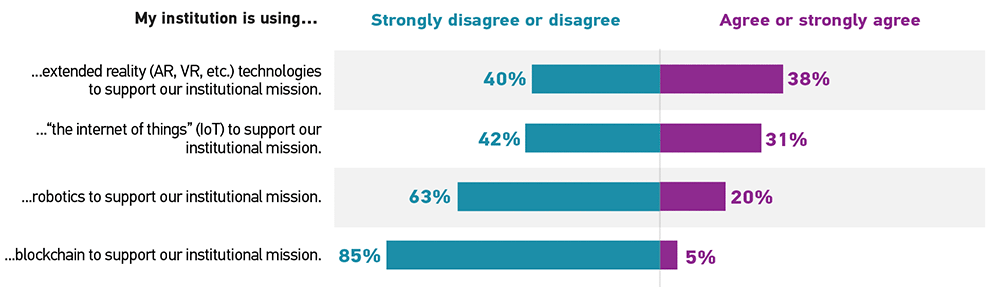
Institutions are not using emerging technologies such as blockchain and robotics to support their institutional mission (see figure 22).

Bar graph showing the percentage of respondents who 'Strongly disagree or disagree' (Disagree) and 'Agree or strongly agree' (Agree) for each statement.  My institution is using extended reality (AR, VR, etc.) technologies to support our institutional mission: Disagree 40%, Agree 38%. My institution is using “the internet of things” (IoT) to support our institutional mission: Disagree 42%, Agree 31%. My institution is using robotics to support our institutional mission: Disagree 63%, Agree 20%. My institution is using blockchain to support our institutional mission: Disagree 85%, Agree 5%.
Figure 22. Institutions: Emerging technology use

Are the Necessary Supports in Place?

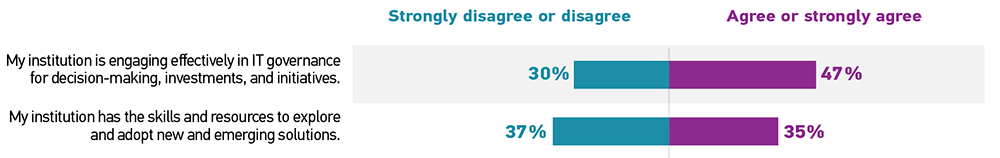
Institutions are engaging effectively in IT governance for decision-making, investments, and initiatives (see figure 23).

Bar graph showing the percentage of respondents who 'Strongly disagree or disagree' (Disagree) and 'Agree or strongly agree' (Agree) for each statement.  My institution is engaging effectively in IT governance for decision-making, investments, and initiatives: Disagree 30%, Agree 47%. My institution has the skills and resources to explore and adopt new and emerging solutions: Disagree 37%, Agree 35%.
Figure 23. Institutions: IT governance


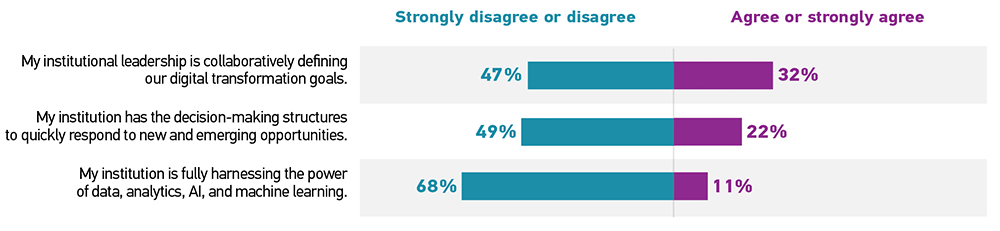
Institutions are not fully harnessing the power of data, analytics, AI, and machine learning (see figure 24).

Bar graph showing the percentage of respondents who 'Strongly disagree or disagree' (Disagree) and 'Agree or strongly agree' (Agree) for each statement.  My institutional leadership is collaboratively defining our digital transformation goals: Disagree 47%, Agree 32%. My institution has the decision-making structures to quickly respond to new and emerging opportunities: Disagree 49%, Agree 22%. My institution is fully harnessing the power of data, analytics, AI, and machine learning: Disagree 68%, Agree 11%.
Figure 24. Institutions: Data, analytics, AI, and machine learning