Digital Transformation Signals: Culture, Workforce, and Technology Shifts

Digital Transformation: Workforce Shifts

Various workforce shifts signal the presence of and engagement in Dx at an institution. The Dx workforce shifts identified below are being adopted at a plurality of responding institutions. It is important to note that nearly all trends and aspects of Dx have a sizable percentage of institutions currently moving forward…with others already lagging behind.

Researchers and faculty are adapting their practices to fit emerging needs and opportunities, and the need for institution-wide skills in data and analytics will be a defining feature of the future higher education workforce.

What Are Institutions Doing?

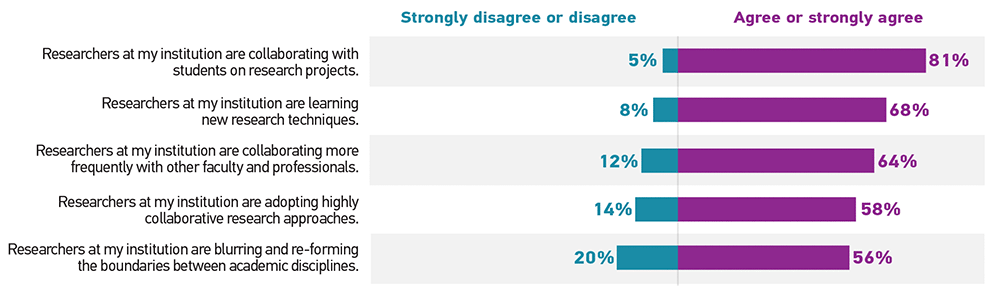
Researchers are changing how they work by collaborating with students and other faculty and professionals, learning new research techniques, adopting highly collaborative approaches to research, and blurring and re-forming the boundaries between academic disciplines (see figure 8).

Bar graph showing the percentage of respondents who 'Strongly disagree or disagree' (Disagree) and 'Agree or strongly agree' (Agree) for each statement.  Researchers at my institution are collaborating with students on research projects: Disagree 5%, Agree 81%. Researchers at my institution are learning new research techniques: Disagree 8%, Agree 68%. Researchers at my institution are collaborating more frequently with other faculty and professionals: Disagree 12%, Agree 64%. Researchers at my institution are adopting highly collaborative research approaches: Disagree 14%, Agree 58%. Researchers at my institution are blurring and re-forming the boundaries between academic disciplines: Disagree 20%, Agree 56%.
Figure 8. Researchers


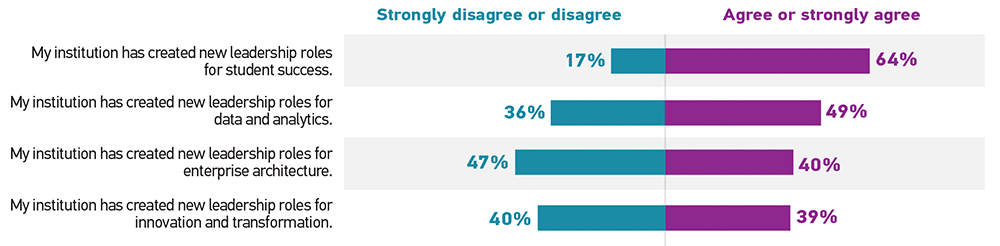
Institutions are creating new leadership positions in the areas of student success and data and analytics (see figure 9).

Bar graph showing the percentage of respondents who 'Strongly disagree or disagree' (Disagree) and 'Agree or strongly agree' (Agree) for each statement.  My institution has created new leadership roles for student success: Disagree 17%, Agree 64%. My institution has created new leadership roles for data and analytics: Disagree 36%, Agree 49%. My institution has created new leadership roles for enterprise architecture: Disagree 47%, Agree 40%. My institution has created new leadership roles for innovation and transformation: Disagree 40%, Agree 39%.
Figure 9. Leadership positions


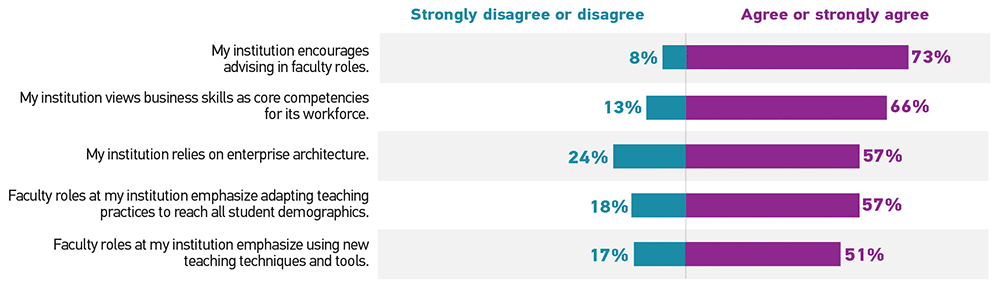
As institutions increasingly rely on both enterprise architecture and business skills across their workforce, faculty are being encouraged to take on more advising, are adapting teaching practices to reach all student demographics, and are using new teaching techniques and tools (see figure 10).

Bar graph showing the percentage of respondents who 'Strongly disagree or disagree' (Disagree) and 'Agree or strongly agree' (Agree) for each statement.  My institution encourages advising in faculty roles: Disagree 8%, Agree 73%. My institution views business skills as core competencies for its workforce: Disagree 13%, Agree 66%. My institution relies on enterprise architecture: Disagree 24%, Agree 57%. Faculty roles at my institution emphasize adapting teaching practices to reach all student demographics: Disagree 18%, Agree 57%. Faculty roles at my institution emphasize using new teaching techniques and tools: Disagree 17%, Agree 51%.
Figure 10. Faculty


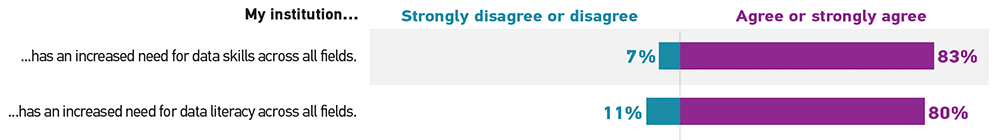
Institutions have an increased need for data skills and data literacy across all fields (see figure 11).

Bar graph showing the percentage of respondents who 'Strongly disagree or disagree' (Disagree) and 'Agree or strongly agree' (Agree) for each statement.  My institution has an increased need for data skills across all fields: Disagree 7%, Agree 83%. My institution has an increased need for data literacy across all fields: Disagree 11%, Agree 80%.
Figure 11. Institutions: Need for data skills and data literacy

What Areas Are Opportunities for Improvement?

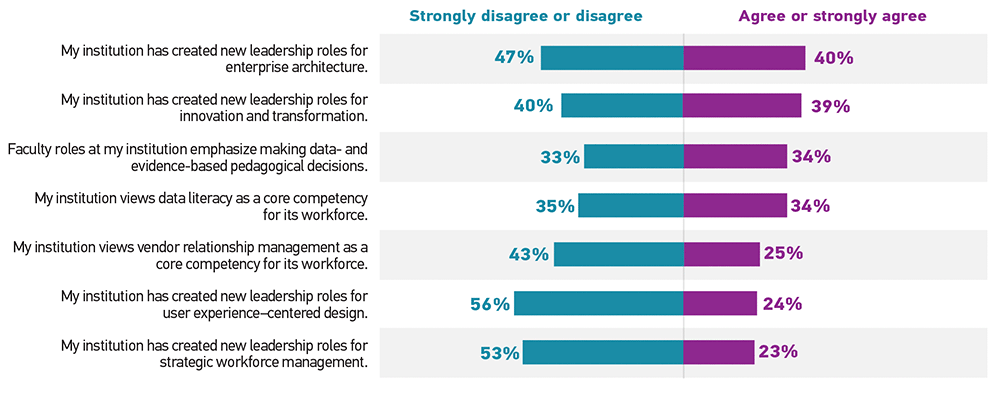
Institutions are not creating new leadership positions in strategic workforce management, user experience–centered design, enterprise architecture, and innovation and transformation (see figure 12).

Bar graph showing the percentage of respondents who 'Strongly disagree or disagree' (Disagree) and 'Agree or strongly agree' (Agree) for each statement.  My institution has created new leadership roles for enterprise architecture: Disagree 47%, Agree 40%. My institution has created new leadership roles for innovation and transformation: Disagree 40%, Agree 39%. Faculty roles at my institution emphasize making data- and evidence-based pedagogical decisions: Disagree 33%, Agree 34%. My institution views data literacy as a core competency for its workforce: Disagree 35%, Agree 34%. My institution views vendor relationship management as a core competency for its workforce: Disagree 43%, Agree 25%. My institution has created new leadership roles for user experience–centered design: Disagree 56%, Agree 24%. My institution has created new leadership roles for strategic workforce management: Disagree 53%, Agree 23%.
Figure 12. Institutions: Leadership positions


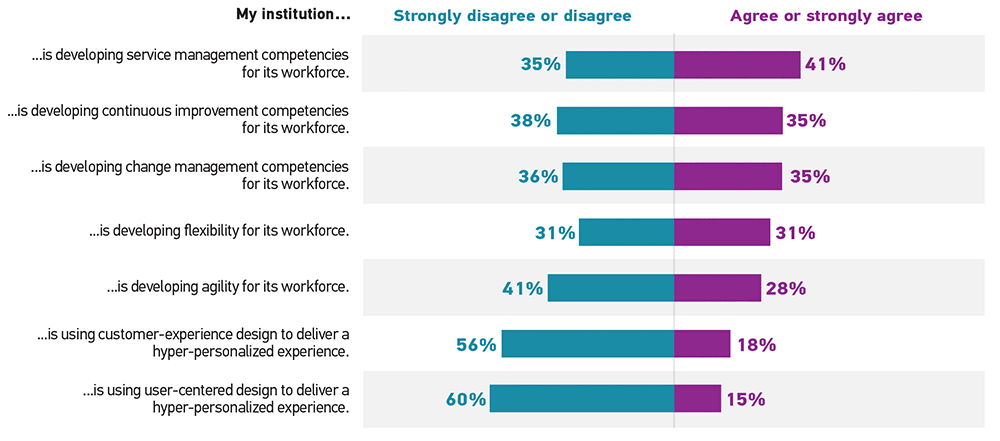
Institutions are not using customer-experience or user-centered designs to deliver a hyper-personalized experience (see figure 13).

Bar graph showing the percentage of respondents who 'Strongly disagree or disagree' (Disagree) and 'Agree or strongly agree' (Agree) for each statement.  My institution is developing service management competencies for its workforce: Disagree 35%, Agree 41%. My institution is developing continuous improvement competencies for its workforce: Disagree 38%, Agree 35%. My institution is developing change management competencies for its workforce: Disagree 36%, Agree 35%. My institution is developing flexibility for its workforce: Disagree 31%, Agree 31%. My institution is developing agility for its workforce: Disagree 41%, Agree 28%. My institution is using customer-experience design to deliver a hyper-personalized experience: Disagree 56%, Agree 18%. My institution is using user-centered design to deliver a hyper-personalized experience: Disagree 60%, Agree 15%.
Figure 13. Institutions: Customer-experience and user-centered designs

Are the Necessary Supports in Place?

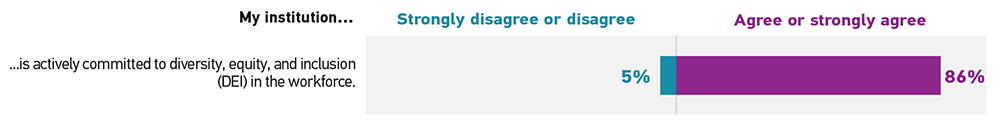
Institutions are overwhelmingly committed to diversity, equity, and inclusion (DEI) in the workforce (see figure 14).

Bar graph showing the percentage of respondents who 'Strongly disagree or disagree' (Disagree) and 'Agree or strongly agree' (Agree) for this statement.  My institution is actively committed to diversity, equity, and inclusion (DEI) in the workforce: Disagree 5%, Agree 86%.
Figure 14. Institutions: DEI commitment


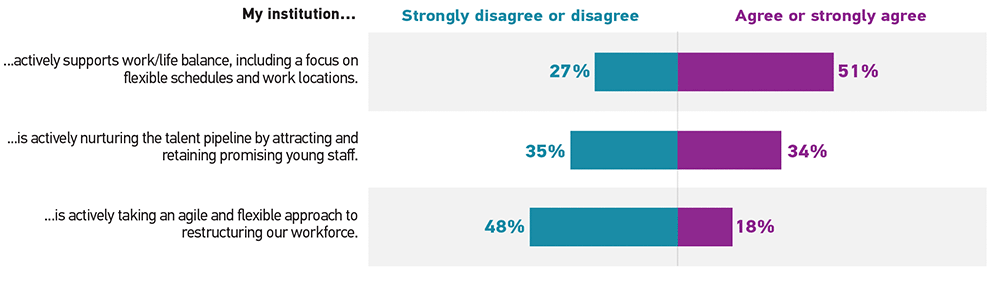
Institutions are not taking an agile and flexible approach to restructuring their workforce and nurturing their talent pipeline (see figure 15).

Bar graph showing the percentage of respondents who 'Strongly disagree or disagree' (Disagree) and 'Agree or strongly agree' (Agree) for each statement.  My institution actively supports work/life balance, including a focus on flexible schedules and work locations: Disagree 27%, Agree 51%. My institution is actively nurturing the talent pipeline by attracting and retaining promising young staff: Disagree 35%, Agree 34%. My institution is actively taking an agile and flexible approach to restructuring our workforce: Disagree 48%, Agree 18%.
Figure 15. Institutions: Workforce and talent pipeline