The Present and Future Institutional Levels of Dx
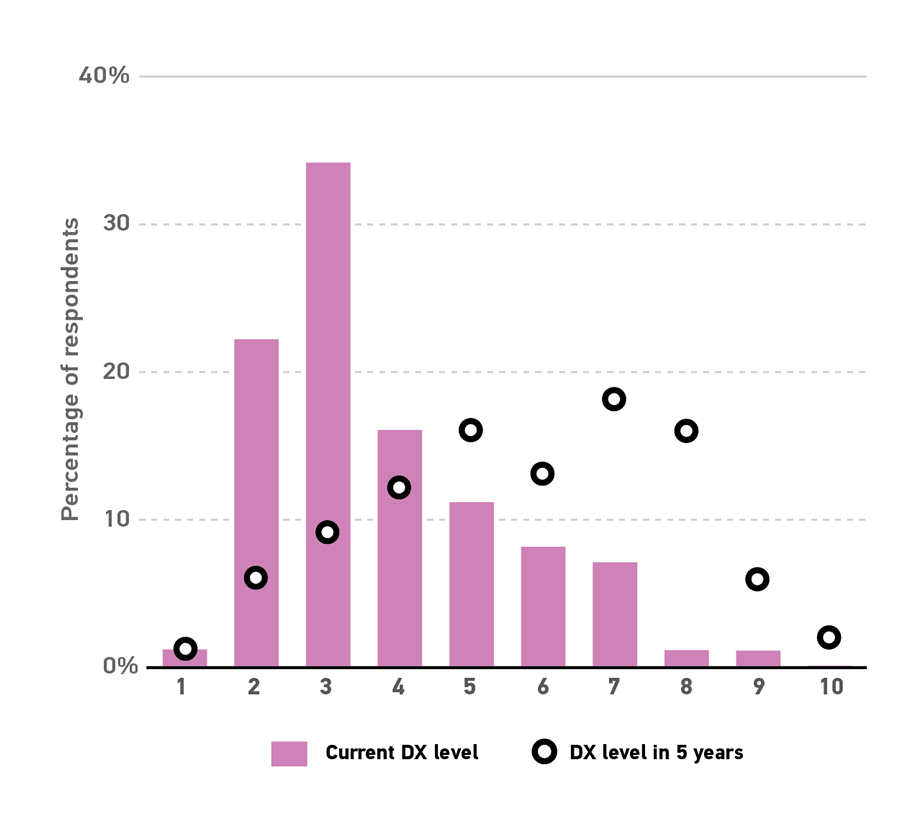
On average, institutional Dx remains considerably underdeveloped, but respondents are optimistic that progress will be made in the next five years. But, those who have yet to start planning for Dx are already behind. We asked respondents to rate their institution's current and future levels of Dx on a scale of 1 to 10, with 10 representing an imagined Platonic ideal of "an institution transformed by digital technologies and capabilities, as well as a correspondingly reshaped culture and workforce that are enabling new educational and operating models, strategic directions, and sources of value." An overwhelming majority of respondents (84%) rated their current levels of institutional Dx on the lower half of the scale (see figure 4); no one thinks their institution has achieved full Dx. Respondents predicted a significant increase in institutional levels of Dx over the next five years, with a majority (56%) expecting to be closer to the ideal than not. Respondents who said their institution has yet to engage in digital transformation at all are significantly more pessimistic about where they will be in another five years than those who have already begun—these respondents on average reported a smaller expected increase in their level of Dx over the next five years compared to respondents who have already started their Dx journeys. In other words, rather than a leveling of the playing field in which late adopters catch up to their peers, responses indicate the next five years will widen the gap between institutions that have not begun in earnest and those at the forefront that will position themselves even farther ahead.