Case Study: Middle Tennessee State University and the Quest for Student Success
Middle Tennessee State University (MTSU) is a comprehensive coeducational public university in Murfreesboro, Tennessee. The university has 22,050 students, of which 50 percent are Pell eligible, 50 percent are first generation, and 40 percent are minority.
With an institution-wide mandate to enhance student success, MTSU launched Quest for Student Success, a new integrated initiative in fall 2012 that focuses on being data informed and strategic, ensuring resources are aligned with strategic needs, and reflecting a "one university" learner-centered model.
MTSU's Student Success Vision Statement states:
MTSU seeks to become a national thought and practice leader in student success. This endeavor will require joint efforts of the student, faculty and broader campus community and the integration of our student-centered support services and data-informed best practices. The goal is to facilitate degree completion, cultivating students who are committed to critical inquiry and life-long learning in a changing global society.
The MTSU action plan has been bold and has included significant investments:
- More than 47 new advisors have been added to the team
- New software solutions from EAB (SSC Campus) and Ellucian (Degree Works)
- Redesign of 27 courses
- New learner supports for tutoring
- Robust communication planning and performance metrics
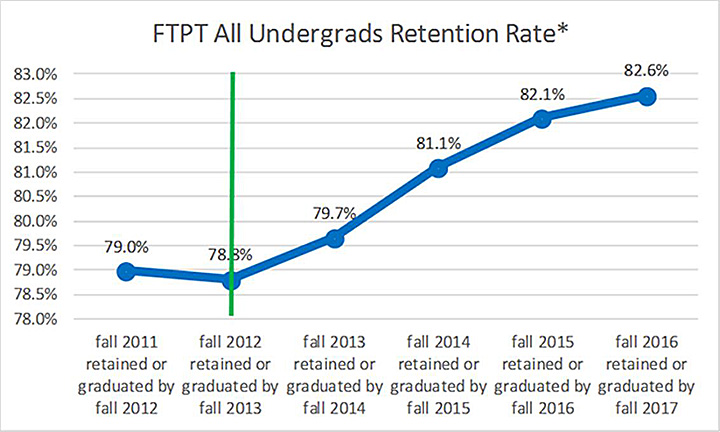
In defining success for the Quest for Student Success initiative, MTSU focuses on improving retention rates. As figure 1 shows, this focus has yielded marked improvements in the overall retention rate since the 2012 launch.
MTSU's overall success in increasing retention rates for undergraduates was also evident for freshman and sophomores alone. For example, for 2012–2016, the freshman rate increased from 68.2 to 72.4 percent. Without those improvements in freshman and sophomore retention rates, MTSU would have had 467 fewer students in fall 2017.
MTSU has taken a holistic view of its student success initiatives (SSIs) by also including an assessment of ROI, focusing on the generation of additional gross tuition and fee revenue from increasing retention. The additional 467 students on campus in fall 2017, for example, are calculated to have produced an additional $2 million in gross tuition and fee revenues.
The university's strategy has also included a focus on reducing DFW rates—that is, grades of D or F, or course withdrawal—in the courses with the highest rates of DFW (known as "predictor courses"), leading to student progression. As table 2 shows, almost 19 percent of students were unsuccessful in those top courses; this amounts to $2.7 million in tuition and fees that students invested that did not lead to a successful completion.
Table 2. MTSU predictor courses—non-success rates and loss of investment
|
Predictor Rank |
Course |
Total Enrollment |
DFW Total |
|---|---|---|---|
|
1 |
HIST 2020 |
1,668 |
372 |
|
2 |
ENGL 1020 |
922 |
227 |
|
3 |
HIST 2010 |
1,625 |
340 |
|
4 |
PSY 1410 |
1,105 |
236 |
|
5 |
ENGL 1010 |
2,418 |
365 |
|
6 |
COMM 2200 |
1,340 |
162 |
|
7 |
ENGL 2030 |
803 |
111 |
|
8 |
MUS 1030 |
968 |
163 |
|
9 |
MATH 1710 |
1,345 |
356 |
|
10 |
THEA 1030 |
869 |
127 |
|
11 |
BIO 1030 |
518 |
94 |
|
Totals |
13,581 |
2,553 |
|
Overall, MTSU is a good example of an institution applying an ROI lens to SSIs. Its investments focus not only on the impact on student success, but also on how those investments support sustainability at the institution.
Additional Resources: